Report: Lower Thames Crossing (LTC) – Options Comparison (Merits‑Only)
Summary for busy readers

- What we did — We compared the Government’s chosen Option C (WSL) with Option A14 (a long bored tunnel at Location A) on scheme‑only merits: congestion/operations, costs & BCR, and environmental footprint. We also looked at how the network behaves on incident days and highlighted where evidence is missing.
- Why now — Consent was granted in March 2025 and early works have started while reported costs sit around £9.2–£10bn. With tight public finances and construction inflation, it’s prudent to pause and re‑test options before committing the full programme.
- How we did it — We pulled National Highways’ own 2016 Scheme Assessment Reports (SARs) and DCO ComMA papers, plus Statements of Common Ground and consultee material; cross‑checked numbers; and flagged gaps (e.g., J2 turning matrices, A13 vs M25 split, and maintenance/incident scenarios). No new modelling; scheme‑only lens.
- What we found (in brief) —
- Economics: A14 ≈ C on Level‑1 economics (both poor Initial BCRs ~0.47–0.48; negative NPV).
- Operations: The A2/LTC node is constrained by HS1 and tight weaves; fragile in peaks/incidents. An A14 tunnel keeps the M25 mainline free‑flow by design.
- Dartford relief: Any reduction erodes by the mid‑2040s without demand management.
- Environment: A14 has a much smaller surface footprint; emissions can be managed at portals if specified.
- Dependencies: The A229 (C‑Variant) sits outside the Project; if not delivered at opening, M2/A229 pressures worsen.
- Conclusions — If the goal is to fix Dartford on scheme merits only, a design‑led A14 long tunnel is the stronger option and is likely far cheaper than Option C. Order‑of‑magnitude comparators for long bored tunnels indicate ~£1.9–£2.3bn for a 10 km twin‑bore bored works + fit‑out (portals/tie‑ins extra), versus £9–10bn for Option C’s full corridor. We recommend a short, independent options refresh comparing C (WSL), a tunnel‑led ESL, A14, and a duplicate QEII bridge, with the missing inputs and incident runs published before ministers choose.
Preamble
Why publish this now (five months after consent). During the consultation phases I intended to produce a like-for-like options review, but the volume and complexity of material meant that, as a volunteer, I did not have the time or tools to do what would normally take a professional consultant. With modern AI assistance now able to search and cross-check the published record, I have revisited the evidence retrospectively. The aim is to set out clear, referenced requests for National Highways and central government to pause and re-test the options on a merits-only basis in today’s very different fiscal climate: record public borrowing, persistent inflation, tighter capital budgets, and a tax/business environment that appears to discourage private investment. Independent reporting puts total scheme costs at at least £9.2bn, potentially around £10bn depending on financing; pressing ahead without a short, transparent re-evaluation is a material fiscal risk.
Purpose and scope. This review compares the government’s selected Option C (Western Southern Link) with Option A14 (a long bored tunnel at Location A) on scheme-only merits: direct transport effects, costs/BCR, operational risks, and environmental footprint. Wider economic growth claims are noted but not used to decide between options.
Context. Consent was granted in March 2025, and preparatory works have begun. Given fiscal pressure and construction inflation, a short, transparent, merits-only options refresh is prudent before irreversibly committing the full programme spend.
Authorship and method. Prepared by Robin Bull (former Chair, LTCA) in a personal capacity, with research assistance from AI tools used to retrieve and cross-check published material. All drafting, interpretation and conclusions are the author’s. Where sources differ, the direction of change is noted and citations are provided; where evidence is missing, this is stated explicitly.
Sources:
National Highways — “Government gives planning permission…” (25 Mar 2025)
National Highways — “What’s next” (confirms DCO granted and next steps)
National Highways — “Seeking permission…” (page notes DCO granted)
Financial Times — “Lower Thames Crossing has cost £1.2bn even before construction starts” (7 Mar 2025) [paywalled]
Financial Times — “One-third of Lower Thames Crossing spending so far used on planning documents” (Apr 2025) [paywalled]
The Guardian — “Lower Thames Crossing plan for Essex and Kent approved” (25 Mar 2025)
The Guardian — “UK government pledges further £590m for delayed Lower Thames Crossing” (16 Jun 2025)
Methods & appraisal framework
- Appraisal lens: Scheme-only (TAG Level-1). Adjusted BCRs (WEBs/reliability) are noted but not used to pick an option.
- Economics: 2010 prices & values; PVB/PVC/NPV; costs include base CAPEX, risk/Optimism Bias, OPEX; report P50/P90 where available.
- Traffic: Strategic modelling supported by junction microsimulation at critical nodes. KPIs: v/c, mean speed, 95th percentile queues, delay, throughput per lane.
- Environment: Land-take, severance, air quality, noise, carbon, landscape; WFD/HRA screening.
- Compliance: DMRB standards; TAG; Distributional Impacts; Net Zero consistency note.
Glossary & abbreviations
-
LTC – Lower Thames Crossing (A122 route)
-
DCO – Development Consent Order (Planning Act 2008)
-
SAR – Scheme Assessment Report (option sifting/evidence)
-
ComMA – Combined Modelling and Appraisal (core DCO appraisal)
-
AST – Appraisal Summary Table (DfT TAG summary)
-
ES – Environmental Statement (Environmental Impact Assessment)
-
TA – Transport Assessment (traffic & junction modelling)
-
SoCG – Statement of Common Ground
-
TAG – Transport Analysis Guidance (DfT methods)
-
VfM – Value for Money (DfT bands based on BCR)
-
BCR – Benefit–Cost Ratio (PVB ÷ PVC)
-
PVB / PVC / NPV – Present Value of Benefits/Costs; Net Present Value (PVB−PVC)
-
WEBs – Wider Economic Benefits (level‑2 uplifts such as agglomeration)
-
NTEM – National Trip End Model (demand inputs)
-
OB – Optimism Bias (risk/contingency uplift in costs)
-
DMRB – Design Manual for Roads and Bridges (standards)
-
AQMA – Air Quality Management Area
-
NOx / PM₂.₅ – Key air pollutants (nitrogen oxides / fine particulates)
-
AADT / PCU – Annual Average Daily Traffic / Passenger Car Unit
-
P50 / P90 – 50th/90th percentile outturn risk values
-
Order Limits – Legal boundary of land for construction/operation/mitigation
-
AONB – Area of Outstanding Natural Beauty
-
HRA / WFD – Habitats Regulations Assessment / Water Framework Directive
-
Do‑Minimum / Do‑Something – Without‑scheme / With‑scheme scenarios
-
WSL / ESL – Western Southern Link (chosen Location C route) / Eastern Southern Link (SAR variant not adopted)
-
D3M – Dual three‑lane motorway cross‑section (3 lanes each way). Used here as D3M + hard shoulder (HS).
-
HS – Hard shoulder (emergency refuge lane beside the carriageway).
-
HGV – Heavy Goods Vehicle (lorries over 3.5 tonnes GVW).
-
SRN – Strategic Road Network (the nationally important motorways and major A‑roads).
-
DfT – Department for Transport (UK government department).
-
NH – National Highways (the government‑owned company operating the SRN in England).
-
QEII – Queen Elizabeth II Bridge at Dartford (southbound A282 crossing of the Thames).
-
VISSIM – Microscopic traffic simulation software used for junction/corridor modelling.
-
OD – Origin–Destination (where trips start and end in the model).
-
Counting line (often called a “screenline”) – A simple line we draw across a road on a map and count all vehicles crossing it to compare scenarios. In this report we just say “traffic totals across a line.”
-
Turning‑movement matrix – Table of flows through a junction by approach/destination, time period and vehicle type.
-
SPA – Special Protection Area (protected site for birds under UK law).
-
Ramsar site – Wetland of international importance protected under the Ramsar Convention.
-
Contraflow – Temporary arrangement running traffic in one carriageway in both directions during works/incidents.
-
Ramp metering – Traffic signals on slip roads used to regulate entry to the mainline and smooth flow.
Executive summary
- Economics: On scheme-only numbers, A14 ≈ C (both Poor; Initial BCR ~0.47–0.48; negative NPV). No clear economic winner.
- Environment: A14’s long bored tunnel delivers materially lower surface land-take and severance; emissions are concentrated at portals where treatment is feasible if specified.
- Operations: Option C’s A2/M2/LTC node is boxed in by HS1 and designated land, relying on several single-lane links and short weaves. That is fragile in peaks and during incidents and leaves little expandability.
- Durability: Modelled relief at Dartford erodes by the mid-2040s as overall demand grows—classic induced-traffic behaviour unless active demand control is applied.
- Dependencies: The A229 (C-Variant) upgrade sits outside the Project. If not delivered at or before opening, M2/A229 pressures in Medway/Maidstone worsen.
- Where the benefits really land: Option C’s clearest gains are north of the river (aligning with the London Gateway/Tilbury logistics corridors). South of the river, communities face the impacts (land-take, A2/M2 diversions) but see limited direct access improvement to Grain/Medway/Sheppey/Thanet unless separate, funded local packages are brought forward.
Conclusion: The public record does not demonstrate that Option C outperforms A14 (or a targeted Dartford duplication) on scheme-only grounds. A short, time-boxed pause and options refresh is justified.
1. Why a merits‑only analysis?
We focus on scheme‑only impacts so the comparison is clear and fair.
-
Wider economic benefits are uncertain. They depend on future planning and private investment outside the scheme. Counting them can over‑state benefits or double‑count growth that would happen anyway.
-
New road space fills up. Evidence on induced traffic shows congestion relief often fades over time. So we look first at the Initial BCR/NPV and direct operational outcomes.
-
Like‑for‑like comparison. Using scheme‑only numbers lets people compare options on the same basis, without different methods or assumptions tipping the scales.
-
Tight budgets. With public finances under pressure, projects with poor Initial BCR or negative NPV should face extra scrutiny before adding speculative uplifts.
1A. Kent‑side growth reality (why we treat ‘growth’ claims cautiously)
What residents see. Option C builds a new through‑route between the A2/M2 and the A13/A1089. It does not plug directly into the Kent places that most need jobs and investment. In plain terms, what will the LTC do for Grain, Medway, Sheppey or Thanet? On current plans: very little, day‑to‑day.
- No new direct access to deprived/coastal areas. There is no high‑standard new link into the Isle of Grain/Thamesport (A228), Medway towns (A289), Isle of Sheppey/Sheerness (A249) or Thanet (A299/A256). Any business choosing these locations would still rely on the same constrained local roads.
- C‑Variant sits outside the Project. The A229 Blue Bell Hill upgrade—important for Medway/Maidstone—has been treated as a separate scheme with uncertain funding/timing (see §5A). If it’s not delivered by opening, M2/A229 pressures worsen with little local benefit.
- Who gains most? North of the Thames, Option C lines up with the London Gateway and Tilbury corridors and their expansion plans. That’s where the clearest logistics benefit lies.
- What that means for people south of the river. Kent communities take the land‑take, construction disruption and, on incident days, diversion traffic on the A2/M2—but see limited direct accessibility gain unless separate, funded local packages come forward.
- Policy ask on behalf of residents. If ministers want Dartford relief, do it by design—for example, a free‑flow M25 mainline via an A14 long‑tunnel, backed by demand management. If the aim is Kent‑side growth, invest inside those corridors first (targeted A249/A228/A289 packages, rail/freight measures), rather than hoping benefits will filter down from a remote trunk road.
Bottom line: without firm, funded local access improvements in Kent, Option C risks more pain than gain south of the river. That is why our headline comparison stays merits‑only, and why any “growth” claims should be tied to specific, deliverable schemes that actually connect into Kent’s communities.

Index of Multiple Deprivation 2019 (ArcGis)
DLUHC OpenDataCommunities – Indices of Deprivation (Source: ArcGis.com)
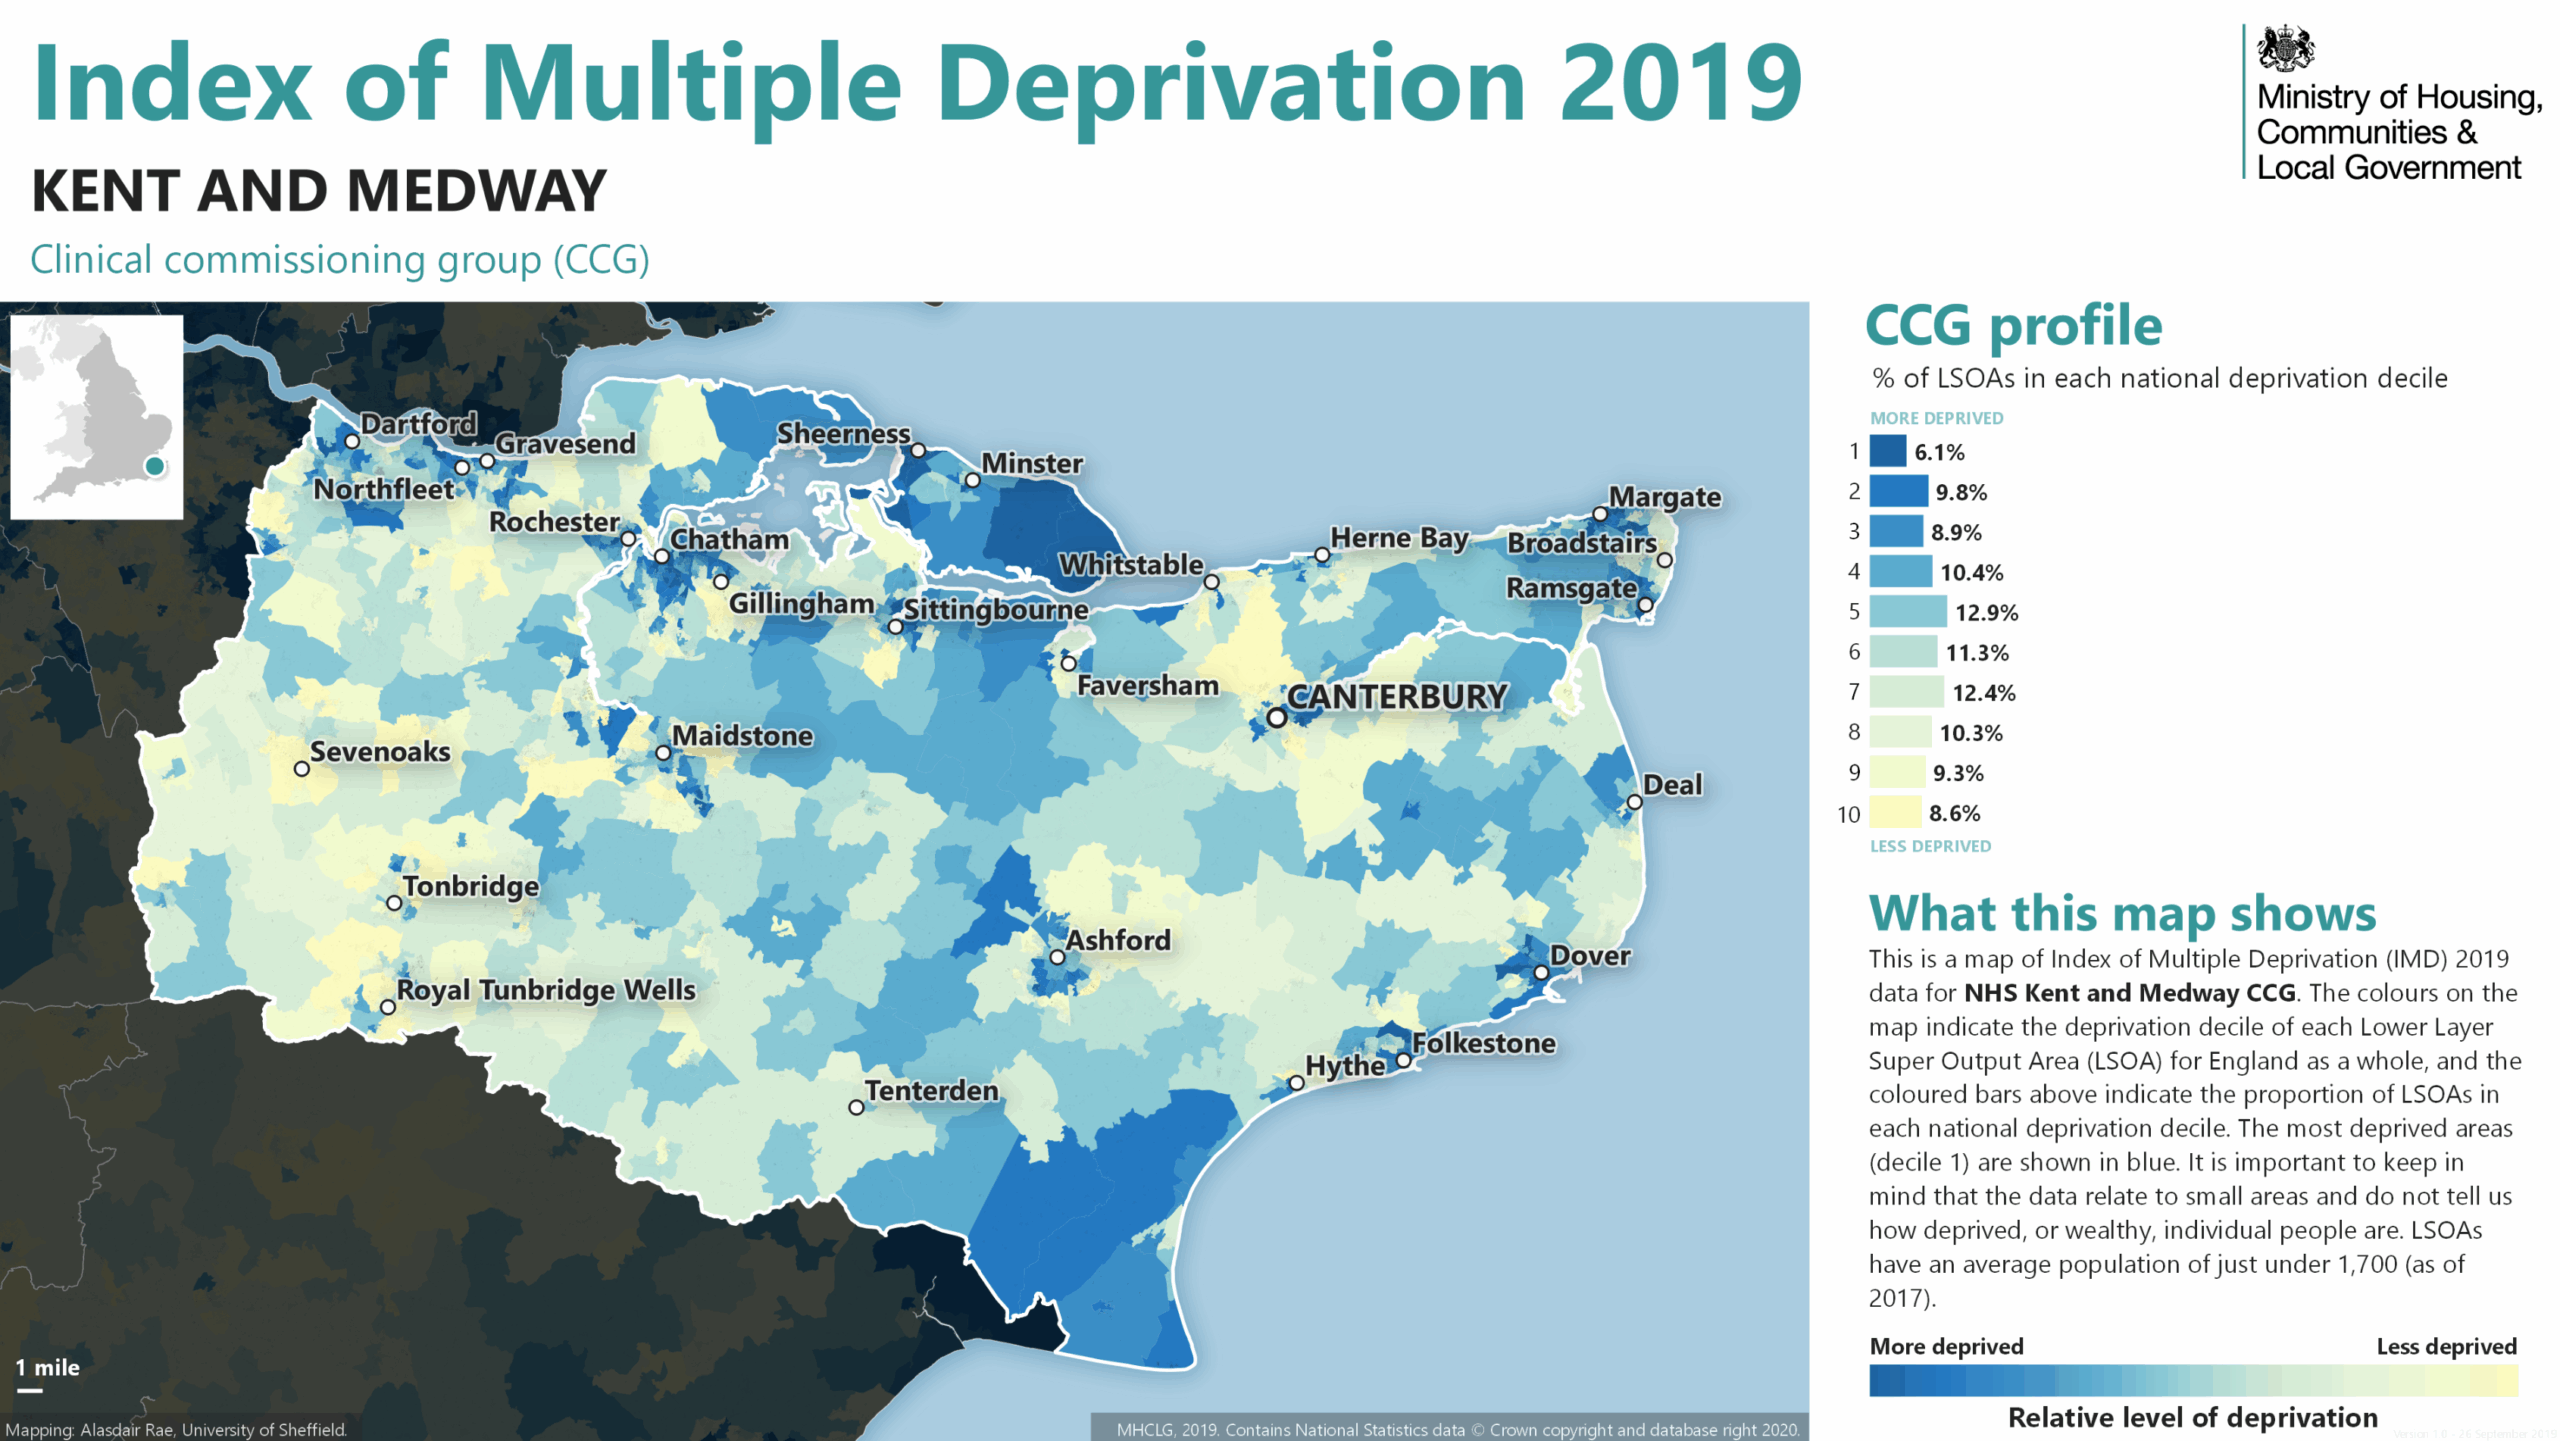
Index of Multiple Deprivation 2019 (Source: IMD 2019 maps by mySociety/Univ. of Sheffield,
IMD 2019 map by mySociety/Univ. of Sheffield. Contains public sector information licensed under the OGL v3.0; IMD 2019 © DLUHC/ONS; basemap © contributors.
2. What the numbers say (scheme‑only)
- Option C (A122 LTC, DCO central case)
– PVB ≈ £1.30bn; PVC ≈ £2.70bn; NPV ≈ −£1.40bn; Initial BCR ≈ 0.48.
– “Adjusted BCR” ≈ 1.22 (with WEBs + reliability) – not used as the merits‑only headline. - Option A14 (Location A long tunnel)
– PVB ≈ £1.53bn; PVC ≈ £3.27bn; NPV ≈ −£1.74bn; Initial BCR ≈ 0.47.
What the terms mean: BCR means benefits divided by costs; NPV means benefits minus costs. All figures here use 2010 prices and values so they are comparable.
Sources & notes
Combined Modelling & Appraisal — Economic Appraisal Report (Mar 2024), §11.2.2: “Initial BCR is 0.48 and Adjusted BCR is 1.22.”
Link text: “Economic Appraisal Report (Mar 2024)” → (nationalhighways site PDF). lowerthamescrossing.co.uk
Budget pressure — record borrowing, persistent inflation and tighter capital budgets heighten the need to prioritise schemes with robust scheme-only VfM.
2A. A14 design assumptions (LTCA interpretation)
- Mainline standard: D3M + hard shoulder (three lanes each way) as a free‑flowing M25 mainline through the Dartford area.
- Speed: 70 mph posted (or 60 mph if safety/emissions policy requires) with consistent enforcement.
- Local access: Local Dartford/Thurrock movements use existing junctions/exits; long‑distance traffic stays on the reserved mainline, away from the existing junctions/exits.
- Surface footprint: New surface works limited to M25 tie‑ins and tunnel portals/vent shafts; no new surface corridor east of Dartford.
- Air quality: Emissions centralised at portals with provision for filtration/conditioning if required by policy.
How to read the figures: Figure 2A-1 shows the reserved M25 mainline through Dartford as a long bored tunnel (D3M + hard shoulder) with local traffic remaining on the existing A282 junctions. Figure 2A-2 shows the indicative long-tunnel alignment at Location A between M25 J2 and J30, emphasising that A14 ties back only to the M25 with no new surface corridor east of Dartford. (Not to scale.)
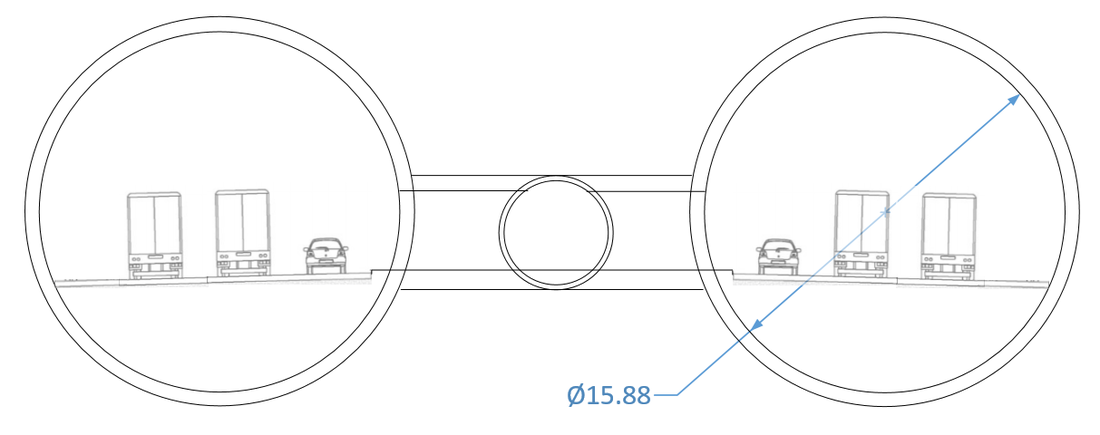
Figure 2A-1 — Indicative twin-bore cross-section for an A14 long tunnel: each bore carries D3M + hard shoulder (three traffic lanes plus hard shoulder) with a separate service/evacuation tunnel between the bores. The Ø15.88 m label is illustrative; final bore size and clearances would be set by detailed design to DMRB tunnel standards, ventilation and safety requirements. Not to scale.
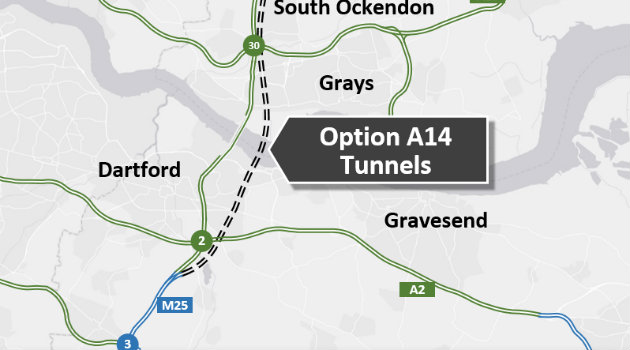
Figure 2A-2. A14 long-tunnel alignment at Location A (indicative): dashed alignment connecting M25 J2 ↔ J30 with labels for Dartford, Gravesend, Grays, Upminster. The concept delivers a continuous free-flow M25 mainline with compact tie-ins only.
Figure 2A-3. A14 concept at Dartford (schematic overlay): a reserved M25 mainline (D3M + hard shoulder) in a long bored tunnel beneath the Dartford area; local Dartford/Thurrock traffic continues to use the existing A282 junctions. Not to scale.

Figure 2A-4. Concept visual for M25 J2A with A14 long-tunnel portals: reserved M25 “Dartford Expressway” lanes dive into a twin-bore D3M + hard shoulder tunnel; local A282 traffic remains on the surface connectors. Signage, charging icons and portal form are illustrative only. Not to scale. © LTCA (RB/BL) photomontage.
2B. Order-of-magnitude cost comparators for an A14-type long tunnel
We cannot price A14 precisely without detailed design, ground investigation and scope definition. Comparable road-tunnel projects give a ballpark. Each differs in bore diameter, geotechnics, safety systems, portals/approaches, land and financing (capex vs. DBFM unitary payments). Treat these as context, not a quote.
What do comparable tunnels cost (in GBP), and what might a 10 km A14 cost?
£1.9–£2.3 billion
Estimated ‘should-cost’ for a 10 km A14 tunnel (twin-bore). Bored works + fit-out. Excludes portals and M25 tie-ins.
Here’s our thinking
Notes: Figures below are order-of-magnitude. Exchange-rate normalisation uses 2025-average rates. Per-km values for short, portal-heavy projects are not good proxies for long bored tunnels.
Comparator projects (all figures rounded)
| Project / Option | Type | Length (tunnel) | Bore Ø | Total cost (GBP) | GBP/km | Notes |
|---|---|---|---|---|---|---|
| A14 (LTCA concept) — “should-cost” | Twin-bore motorway (D3M + HS) | 10 km | ≈15.9 m | £1.9–£2.3 bn | £190–£230 m/km | Scaled from Rogfast & Stockholm; bored works + fit-out; excludes portals/tie-ins. |
| Option C (chosen LTC) | 4.2 km twin-bore + surface corridor | ~4.2 km | ~16 m | £9.2–£10.0 bn | n/a | Total scheme includes 20+ km of surface links/junctions. |
| Stockholm Bypass (SE) | Urban twin-bore motorway network | 18 km | (3 lanes + shoulder) | ≈£3.18 bn | ≈£177 m/km | SEK 41.7bn (2021); 2025-avg FX. |
| E39 Rogfast (NO) | Long subsea twin-bore | 26.7 km | ≈10.5 m | ≈£1.79 bn | ≈£67 m/km | Good long-tunnel analogue; smaller bore. |
| Silvertown (London) | Short urban twin-bore | ~1.4 km | 11.9 m | ≈£1.2 bn | ≈£857 m/km | Portal-heavy; poor long-tunnel proxy. |
Normalisation & assumptions
- 2025-avg FX used for comparability (not inflation adjustment): SEK/GBP ≈ 13.12; NOK/GBP ≈ 13.82; HKD/GBP ≈ 10.22.
- “Option C” total is the widely reported scheme range (~£9.2–£10.0bn); includes surface corridor so not comparable per-km.
- Stockholm Bypass is functionally a 3-lane+shoulder tube each way; no reliable published bore Ø — treated as diameter-equivalent for scaling.
Why we normalise:
Published figures are in different currencies, price‑bases and geometries. For a fair, ballpark comparison we: (1) convert headline costs to 2025‑average GBP exchange rates, and (2) show cost per km, then a simple diameter‑×‑length scaling to a hypothetical A14 = 10 km twin‑bore, Ø≈15.9 m.
How we derive A14’s “should-cost”.
We scale from two long-tunnel analogues: Rogfast and the Stockholm Bypass.
• Rogfast → A14: Rogfast is ≈£67 m/km with ≈10.5 m bores. Scaling by excavated area (∝ D²) to A14 Ø≈15.9 m gives a factor (15.9/10.5)² ≈ 2.29, so ≈£154 m/km. For 10 km, ≈£1.54 bn (bored works & fit-out only).
• Stockholm → A14: Stockholm is already a three-lane + shoulder twin-bore and averages ≈£177 m/km over 18 km of tunnels. For 10 km, ≈£1.77 bn.
Taking these together, then allowing a UK urban/consents/fit-out premium of roughly +10–30%, we get a practical band for a 10 km A14 bored tunnel of ≈ £1.9–£2.3 bn (bored works & fit-out). This excludes portal architecture and M25 tie-ins, which would be additional—but A14 avoids the multi-mile greenfield surface corridor that drives much of Option C’s cost.
Takeaway: On this normalised basis, a 10 km A14 long tunnel appears to be of the same order as other major motorway-tunnel projects (and far below Option C’s total £9–10 bn once its surface corridor is included), while retaining A14’s environmental advantages (small surface footprint, emissions control at portals).
3. Congestion & network performance
- At opening: reduction at Dartford depends on how it’s measured: ~14% (2016 consultation AADT claim) versus ~17–26% by peak hour in 2030 (DCO modelling), often summarised as ~19%. By the mid‑2040s the net reduction shrinks to ~13–14% as overall demand grows.
- Over time: total cross‑river trips grow; by the mid‑2040s Dartford flows approach 2016 levels.
- Risk: without ongoing charging or demand management, congestion pressure will remain at Dartford and on the new Option C links.
Sources & notes
- 2016 consultation / local authority material citing ~14% reduction at Dartford at opening.
- NH “Comments on WRs — Appendix G” (2023): by mid-2040s, Dartford reduction ~14% (9% AM peak).
3A. Incidents & diversion risk (A2, A227 and local roads)
-
What residents see: when there’s a serious incident or closure at Dartford, drivers try to reach an alternative crossing. With the LTC in place, many will head for it via the A2, or spill onto local roads like the A227 from further afield (e.g., M25→M26). B‑roads and estate streets already suffer when queues build on the A2.
-
What NH have said in consultation rooms: they design for “normal” conditions, not for exceptional events. That is common in strategic modelling, which typically represents an average day rather than worst‑case disruption.
-
Why this matters: even if average‑day flows at Gravesend fall slightly, incident days can be much worse. Sat‑nav re‑routing means local roads take the strain. Without strong diversion routes, junction management and consistent charging, the A2 can effectively act as a bypass for the M25, pushing heavy traffic past homes and schools.
-
What should be tested: scenario runs for (i) northbound tunnel closures, (ii) multi‑hour incidents, (iii) high‑wind QEII bridge closures, with and without charging. Publish the link‑by‑link results for the A2/M2 and key local roads.
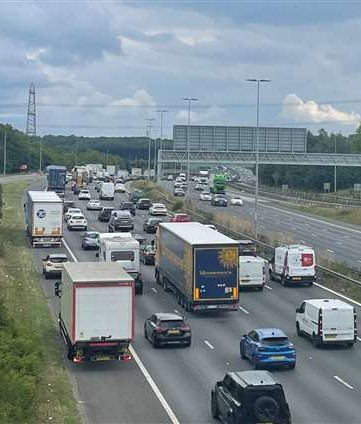
Traffic queue on A2 near Gravesend (Source: Kent Online)
3B. A2/M2 junction redesign — lane‑balance & bottleneck risk
What is being built.
National Highways’ design keeps the A2 mainline at four lanes with parallel one‑way connector roads between M2 J1 and the LTC tie‑in. These connector roads are generally two lanes each as set out in NH’s design documentation (2018), but some specific links/ramps from the A2 to the connectors (and from the connectors to the LTC/A2) are single‑lane in the DCO drawings. (See the lane‑allocation storyboard figure.) The intent is to separate long‑distance and local movements.
What their own microsimulation shows.
In NH’s VISSIM forecasting, the A2/M2 corridor is “free‑flowing overall”, but several merge points are forecast to hit capacity in peaks (Gravesend Central merges; M2 ↔ A289 merges). Merges onto the A122 northbound operate at the upper limit of free‑flow due to portal lane constraints.
Why this matters for the A2.
Even without a literal reduction of the A2 to two lanes, the effective through‑capacity for some movements can be pinched by lane balance, weaving and short merges. On busy days, this behaves like a lane drop, risking tailbacks that can extend past Gravesend (and, in stress events, towards Dartford). Slow/stop‑start flow also worsens emissions compared with steady speeds.
What should be published (evidence):
- A single lane‑allocation storyboard for the A2/M2 tie‑in showing exactly how many lanes each movement gets through the junction, by direction, and where lane drops/additions occur.
- The link‑by‑link flow and speed plots for the A2/M2 in opening year and design year, so communities can see where queues are most likely.
Lane‑allocation snapshot (indicative, from NH engineering drawings):
- A2 mainline (M2 J1 ↔ Gravesend): generally D4 each way (four lanes), with one‑way parallel connector roads alongside.
- Parallel connector roads: typically 2 lanes each direction; designed to separate local/long‑distance movements.
- A2 → connector entries (both directions): several single‑lane entry ramps from the A2 onto the connector roads (pinch‑point risk under stress).
- Connector → A2 exits (both directions): mix of single‑lane and two‑lane drops back to the A2 mainline; short merge/weave sections identified at Gravesend‑area interfaces.
- M2 WB → LTC NB on‑slip: multi‑lane merge (2–3 lanes) converging toward the LTC mainline; operation close to free‑flow capacity in peaks.
- LTC SB → A2 WB off‑slip: generally two lanes dropping to the A2/connector system with short weaving distance before downstream merges.
- A2/M2 ↔ A289 interfaces: merges noted as at/near capacity in peak periods in microsimulation.
Notes: Exact lane counts vary by sheet/chainage; the above is an indicative summary for readers. The accompanying schematic will illustrate the specific lane counts per movement.
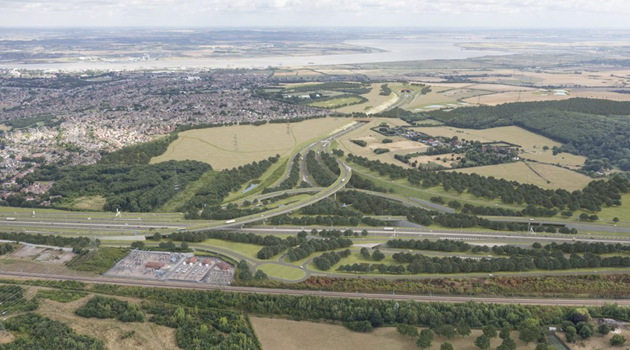
Proposed A2/M2/LTC(A122) Junction
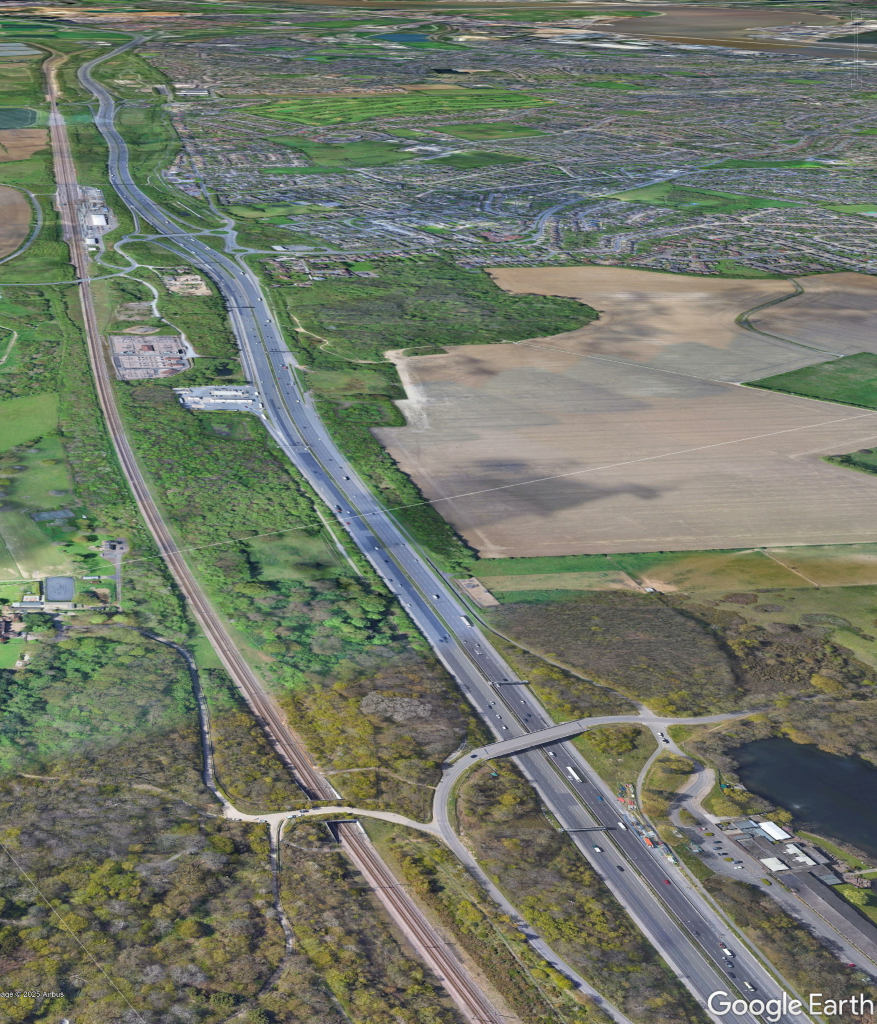
HS1 and the A2 in close proximity
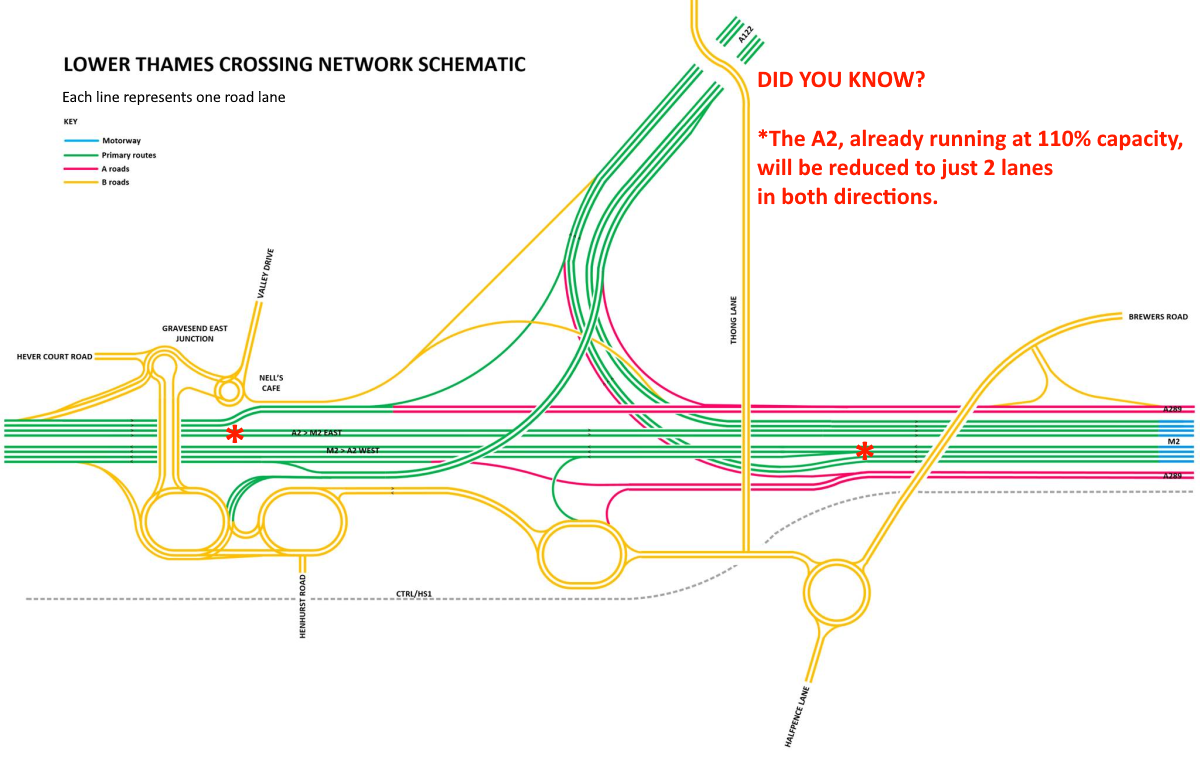
Schematic of the A2/M2/LTC(A122) Junction. Each line represents a single lane.
Design complexity & expandability.
Around the A2/LTC junction, the layout is boxed in by the HS1 rail corridor immediately to the south and designated/valued habitats and existing development to the north. That leaves very limited room for longer merges, auxiliary lanes or any future widening; several movements are therefore handled by short single‑lane ramps and tight weaving. In practice there is no realistic scope for expanding capacity later without major cost and impacts. By contrast, an A14 long‑tunnel option would tie back into the existing M25 corridor, allowing comparatively simpler, compact free‑flow connectors as part of a continuous D3M+HS mainline, with less need for stacked local connections.
Cross‑reference: See the C‑Variant dependency risk in §5A.
Where worst congestion is likely (by scenario):
- Normal peaks with LTC open:
- M2 WB → A2 WB connector and merge west of M2 J1 (single‑lane entries and short weave behave like an effective lane drop). Queues can propagate back along M2 WB toward J3 under stress.
- A122 NB approach to the north portal (portal lane constraint) with knock‑on to the A2 connector system.
- A13 / A1089 (Orsett Cock / Tilbury) if the northbound split favours A13 movements (risk of back‑propagating queues affecting the LTC NB mainline).
- Incident/maintenance at Dartford:
- A2 WB mainline (Gravesend → Dartford) as flows route to the LTC; spillover onto A227, B‑roads and estate streets when the A2 queues build.
- A2 EB → LTC SB and LTC SB → A2 WB weaving zone near Gravesend East if local and long‑distance movements overlap.
- If C‑Variant (A229) is not delivered at opening:
- M2 J3 / A229 Blue Bell Hill interchange (already highly stressed). Additional LTC‑related movements intensify queues, with spillback onto the M2 and pressure on Medway/Maidstone local roads (e.g., A2045).
3C. Where northbound LTC traffic goes (destination split)
Published NH material indicates that a large share of northbound LTC traffic distributes onto the A13 corridor rather than continuing to the M25. Notably, a 2021 design update removed one lane southbound between the M25 and A13 because forecast flows on that link did not require three lanes—a design choice that reflects lower M25↔A13 demand than first assumed.
Evidence gap. The DCO Transport Assessment does not publish a single, public turning‑movement table giving the LTC‑northbound split (A13 vs M25) by time period/vehicle class. We therefore request publication of those matrices and avoid quoting precise percentages until NH release them.
Observed approach mix at Dartford. On incident days, queues typically stack first on the M25 anticlockwise upstream of J3, not on the A2/M20 slips—consistent with the M25 anticlockwise being the main feeder to the Crossing. This supports the case for targeted Dartford measures and for publishing turning matrices that show how much A2/M2 demand actually turns north at J2.
Illustrative observation (20 Aug 2021). A live‑traffic snapshot captured long queues on the M25 anticlockwise past J3, with only moderate queues on the A2—consistent with the pattern above. This is qualitative evidence; we still request published turning counts to confirm shares by approach.
Implication: If more LTC traffic uses A13 movements than the M25, then benefits for M25‑north movements are smaller than some narratives imply, while east‑of‑London corridors (A13/A130/A12) see proportionally more change.
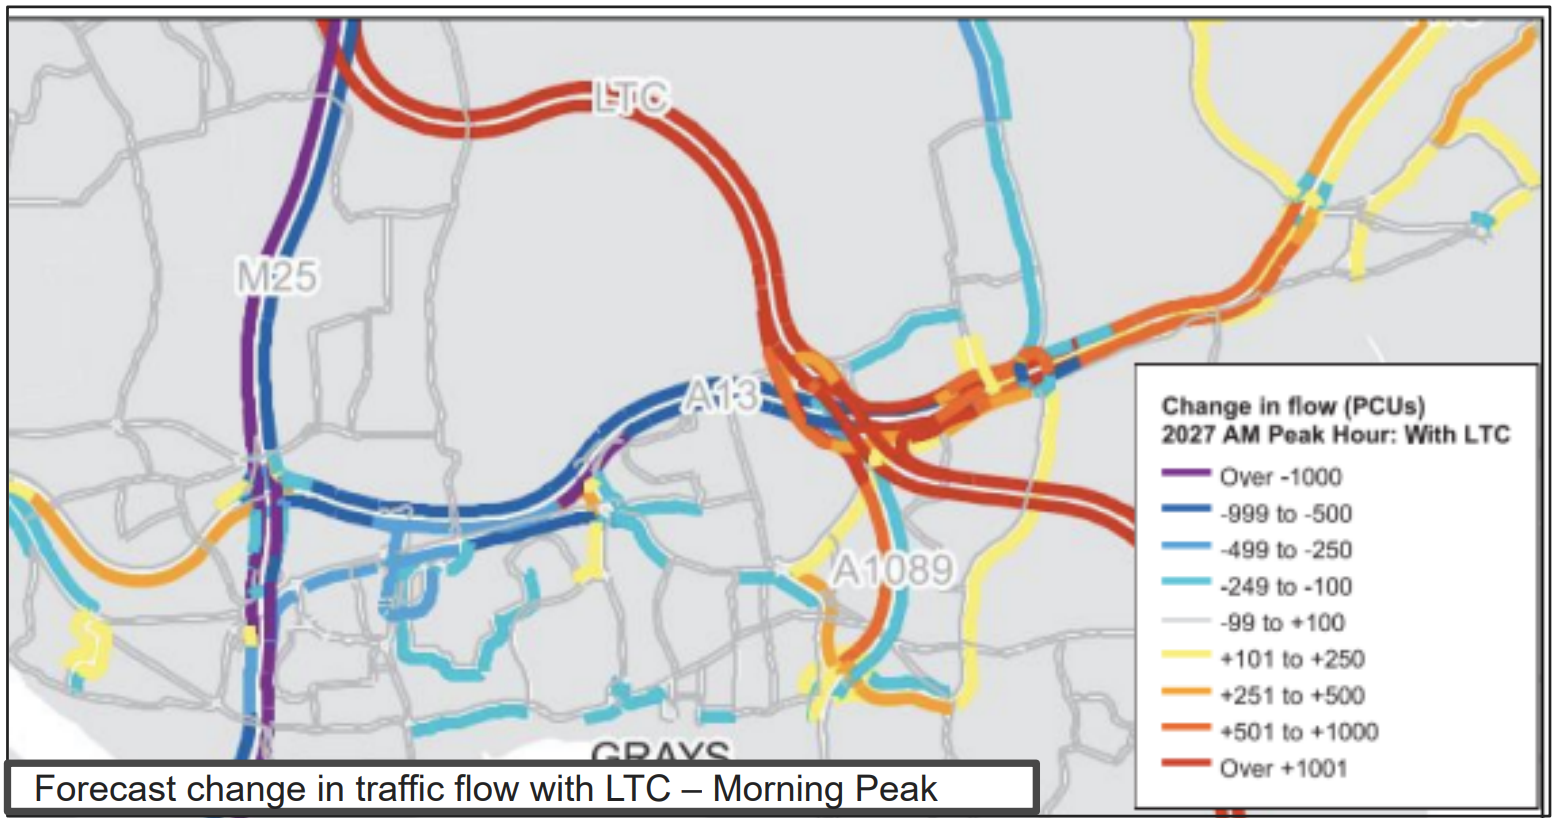
A13 Forecast changes in traffic flow (Source: Stantec / National Highways)
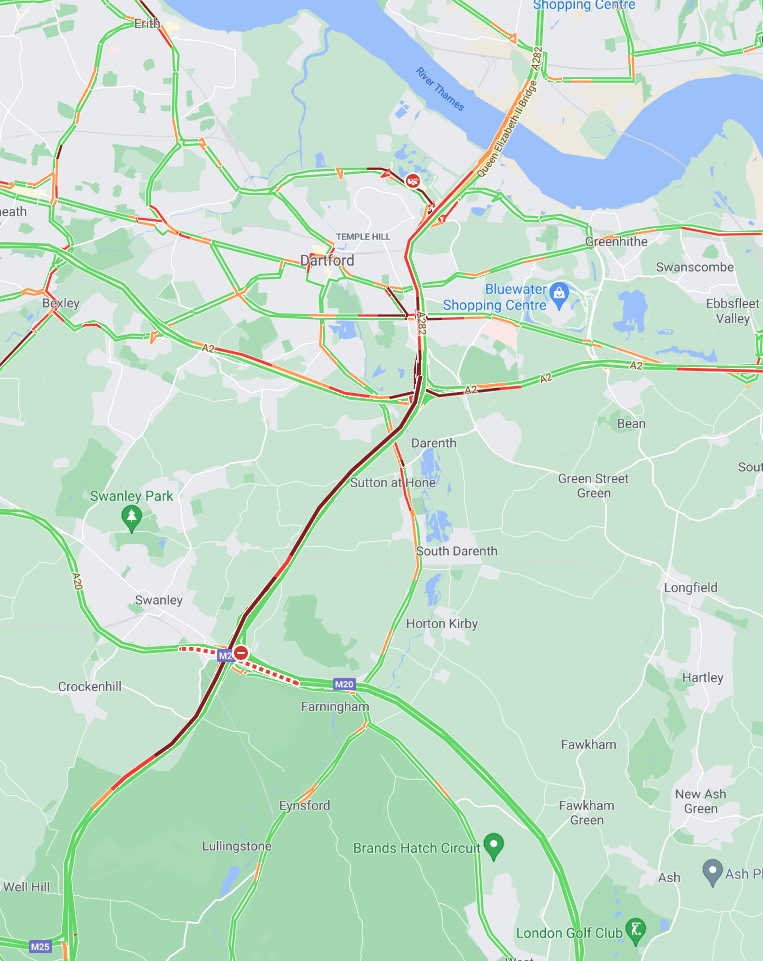
LTC incident observation on Google Maps
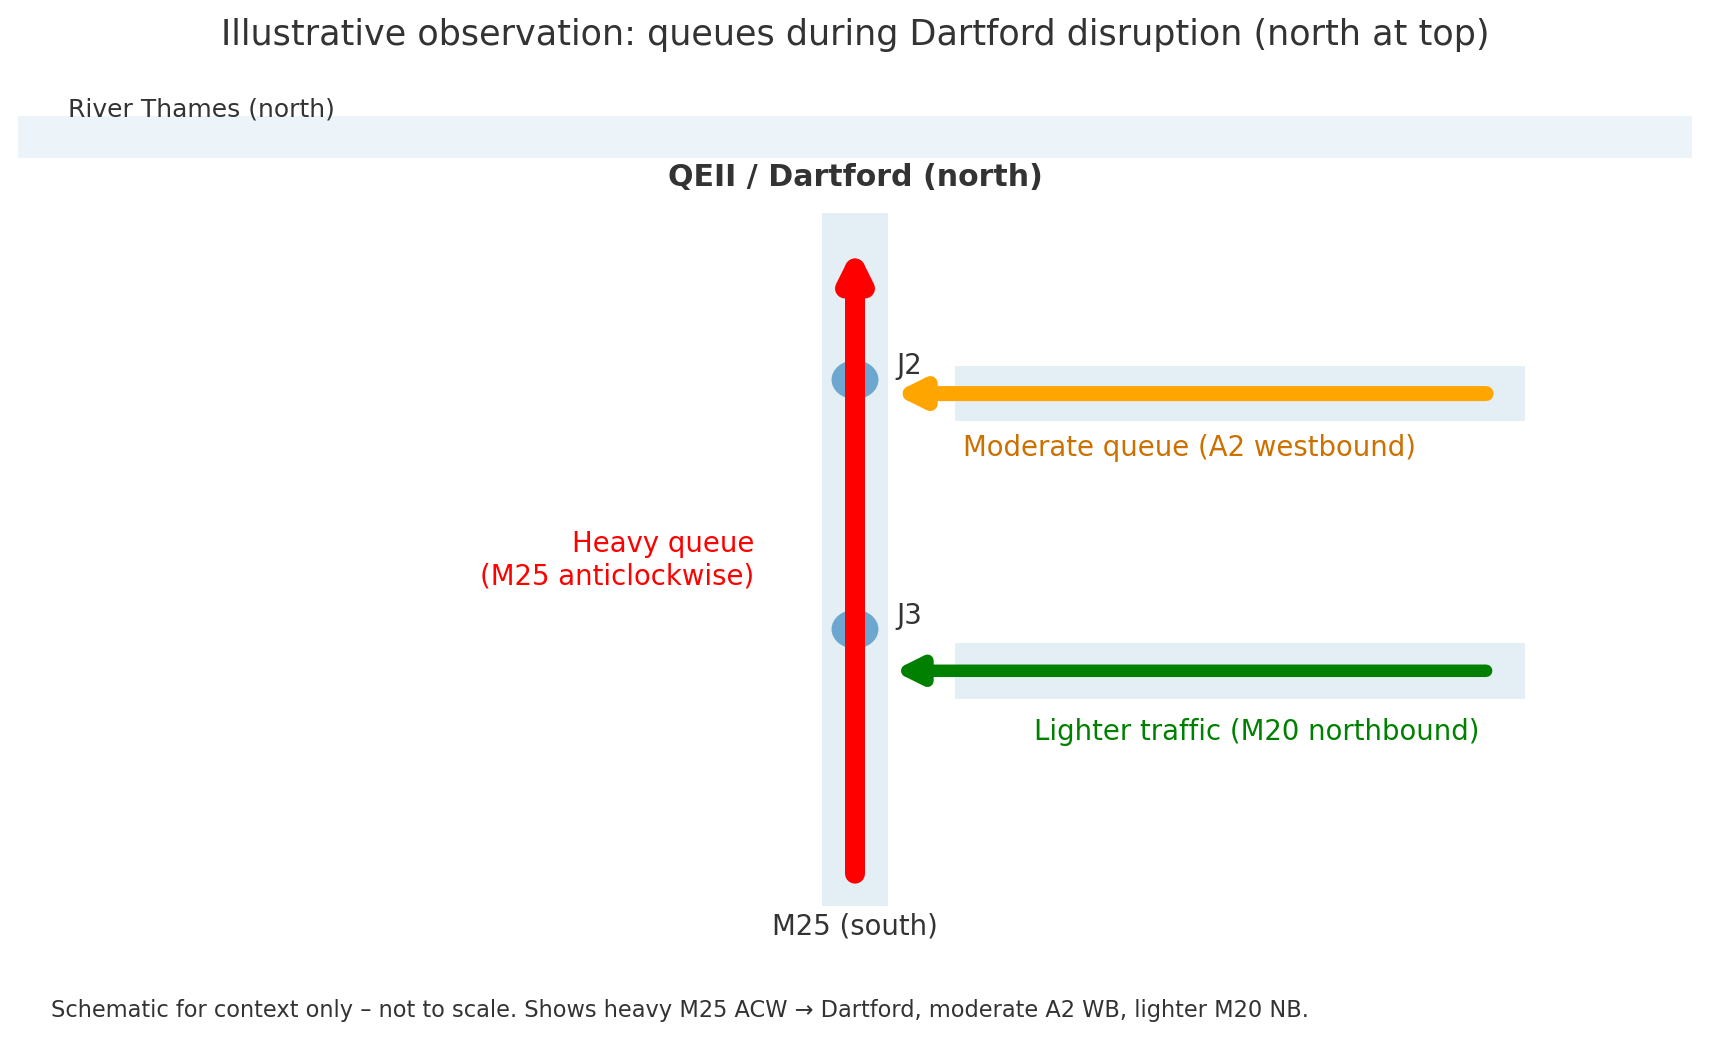
Figure 3C‑1 — Incident‑day queue pattern (north at top). Schematic based on a live‑traffic snapshot (20 Aug 2021). Shows heavy M25 anticlockwise, moderate A2 westbound, lighter M20 northbound; J3 south of J2. (Illustrative; not to scale.) If more LTC traffic uses A13 movements than the M25, then benefits for M25‑north movements are smaller than some narratives imply, while east‑of‑London corridors (A13/A130/A12) see proportionally more change.
LTC incident observation schematic
3D. The M2/Channel ports question — who actually turns north at J2?
Known infrastructure context. A dedicated free‑flow flyover at M25 J2 now carries A2 westbound → A282 north (Dartford Crossing) movements without the roundabout, indicating this is a material movement. However, the DCO material does not publish a full turning‑movement breakdown by approach for J2.
Observed congestion pattern. During severe delays at Dartford, queues commonly build first on the M25 anticlockwise upstream of J3, not on the A2 or M20 slips—consistent with the M25 anticlockwise being the dominant approach to the Crossing. This is a behavioural observation (e.g., live traffic maps/incident days), not a substitute for published counts.
Why this matters. If the dominant approach to Dartford is the M25 anticlockwise, then models that assume a large diversion from the M2/A2 to the LTC may over‑state relief for Dartford while under‑reporting pressure at the A2/M2 tie‑in. Conversely, if turning counts show a higher‑than‑expected A2→J2 north share, that should be made transparent so communities can plan for the A2 corridor impacts.

The A2 at its interchange with the M25. (Source: geograph.org.uk – 3631564)
What should be published to settle this:
-
A turning‑movement matrix for M25 J2 (opening year and design year) for Do‑Minimum and Do‑Something, with HGV shares identified.
-
Traffic totals across a line on the A2 west of Gravesend and between M2 J1–J2 to show how much traffic is actually London‑bound vs using a river crossing.
-
The flow‑speed plots through the A2/M2 tie‑in under AM/PM peaks, so communities can see where queues and stop‑start emissions are most likely.
Air‑quality note. If lane balance/merges create stop‑start conditions on the A2/M2, emissions per km are higher than at steady speeds. Queue‑creation at the new junction would therefore have a local air‑quality downside as well as a congestion downside.
3E. Major maintenance at Dartford — what happens with LTC?
What we know: The Dartford Crossing needs regular closures for tunnel and bridge maintenance (including waterproofing and safety systems). When one bore or the bridge is shut, traffic is diverted through the remaining tunnel(s) with height limits and complex re‑routing. That keeps some traffic moving but constrains HGVs and reduces overall capacity.
Why this matters with the LTC open: If one Dartford tunnel requires multi‑week works (or repeated night/weekend closures), there is a real risk that M25 anticlockwise traffic will route via the A2 and LTC—either by driver choice or sat‑nav re‑routing (even without official diversion signage)—as the alternative cross‑river route. That would push very large flows onto the A2/M2 tie‑in and nearby local roads, creating long queues and worse air quality for communities in Gravesham and Dartford. Height restrictions and contraflow arrangements would also lead to more stop–start and re‑routing, amplifying the impact.
What National Highways should publish in advance:
- A transparent major‑maintenance diversion plan for Dartford with the LTC open, showing (i) expected volumes, (ii) HGV arrangements under tunnel height limits, and (iii) how long diversions would be used.
- Scenario modelling (opening year and design year) of multi‑week single‑bore closures and full QEII bridge night closures, with link‑by‑link flows for the A2/M2, A227 and key local roads.
- A mitigation package for the A2 corridor during major works: temporary speed/flow controls, ramp metering/junction management, freight timing windows/holding areas, and, if needed, temporary pricing to protect local areas.
Takeaway: The LTC does not make Dartford maintenance painless; it moves much of the pain to the A2 corridor. Keeping long‑distance traffic moving should be solved by design—for example, a reserved, free‑flow M25 mainline as in the A14 long‑tunnel concept—with traffic management as a supporting measure. Without a design‑led solution (and, where needed, supporting controls), diversion traffic and pollution fall on local communities.
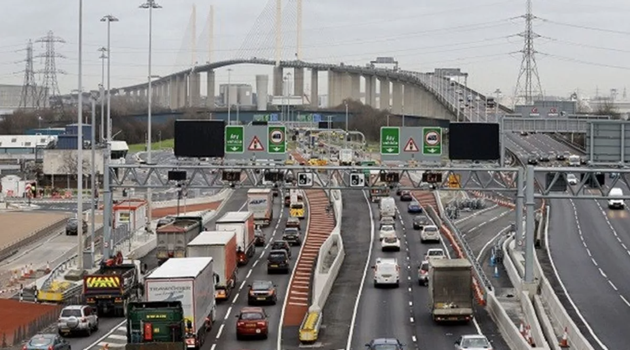
Dartford Crossing Congestion
Traffic queue on A2 near Gravesend (Source: Kent Online)
Table 3E.1 — Incident scenarios: key outputs (illustrative)
| Scenario | Time window | Assumptions | Link / Junction | v/c (%) | Mean speed (mph) | 95th pct queue (m) | Queue time (min) | Throughput (veh/hr/lane) | Local road impact |
|---|---|---|---|---|---|---|---|---|---|
| S2a: NB Dartford tunnel closed (8h) | AM peak (07:00–10:00) | No charge change; sat‑nav rerouting | A2 WB: M2 J1→Gravesend | 103 | 26 | 1,200 | 18 | 1,650 | A227 +18% AADT eqv. |
| A122 NB: portal approach | 98 | 34 | 650 | 8 | 1,700 | Tilbury approaches +12% | |||
| S2b: QEII high‑wind (night closures) | PM inter‑peak | Managed diversion timings | A2 EB: Gravesend→M2 J1 | 91 | 42 | 350 | 6 | 1,720 | Local B‑roads +7% |
| S2c: A2 WB incident (3h) | PM peak (16:30–19:30) | Hard shoulder closed for works | M2 WB→A2 WB connector | 110 | 21 | 1,450 | 24 | 1,480 | Spillback to M2 J3; estates cut‑through |
Notes: v/c = volume/capacity; speeds are link means; queues are 95th percentile maximum back‑of‑queue. Local road impacts shown as indicative percentage increases vs Do‑Minimum.
3F. Implication — should a more easterly crossing be revisited?
If LTC northbound flows primarily distribute along the A13 corridor, there is a case to examine whether a more easterly crossing—with stronger ties to A13/A130/A12 or a southern approach via the A249—would better match actual desire lines on a merits‑only basis. Any revisit would need to weigh:
• Transport merit (OD patterns, HGV shares, durability of relief).
• Network fit (impacts on A13/A130/A12 and M2/M20/A249 junctions).
• Environment (highly designated SPA/Ramsar areas — requires rigorous, proportionate assessment; not an automatic veto).
• Costs/VfM (scheme‑only BCR/NPV with realistic mitigation/consents).
Context note — Thames Estuary airport precedent. A previous government seriously examined a new airport in the Inner Thames Estuary—an option with a footprint and impacts orders of magnitude larger than any road corridor. That precedent shows central government has, at times, been willing to consider very large works in this area. By comparison, if evidence showed that east‑of‑London desire‑lines dominate, a road crossing should be assessed on a proportionate basis: the SPA/Ramsar tests still apply and must be met, but there is no automatic “show‑stopper” purely from location.
Position clarity. We are not saying “put the road further east.” Communities there also deserve protection. Our stance is: first, fix Dartford by design (e.g., an A14-type, free-flow M25 mainline). If policy shifts to serve east-of-London movements, then test any easterly option on a merits-only basis with robust safeguards, so we avoid the charge of simply moving impacts from one community to another.
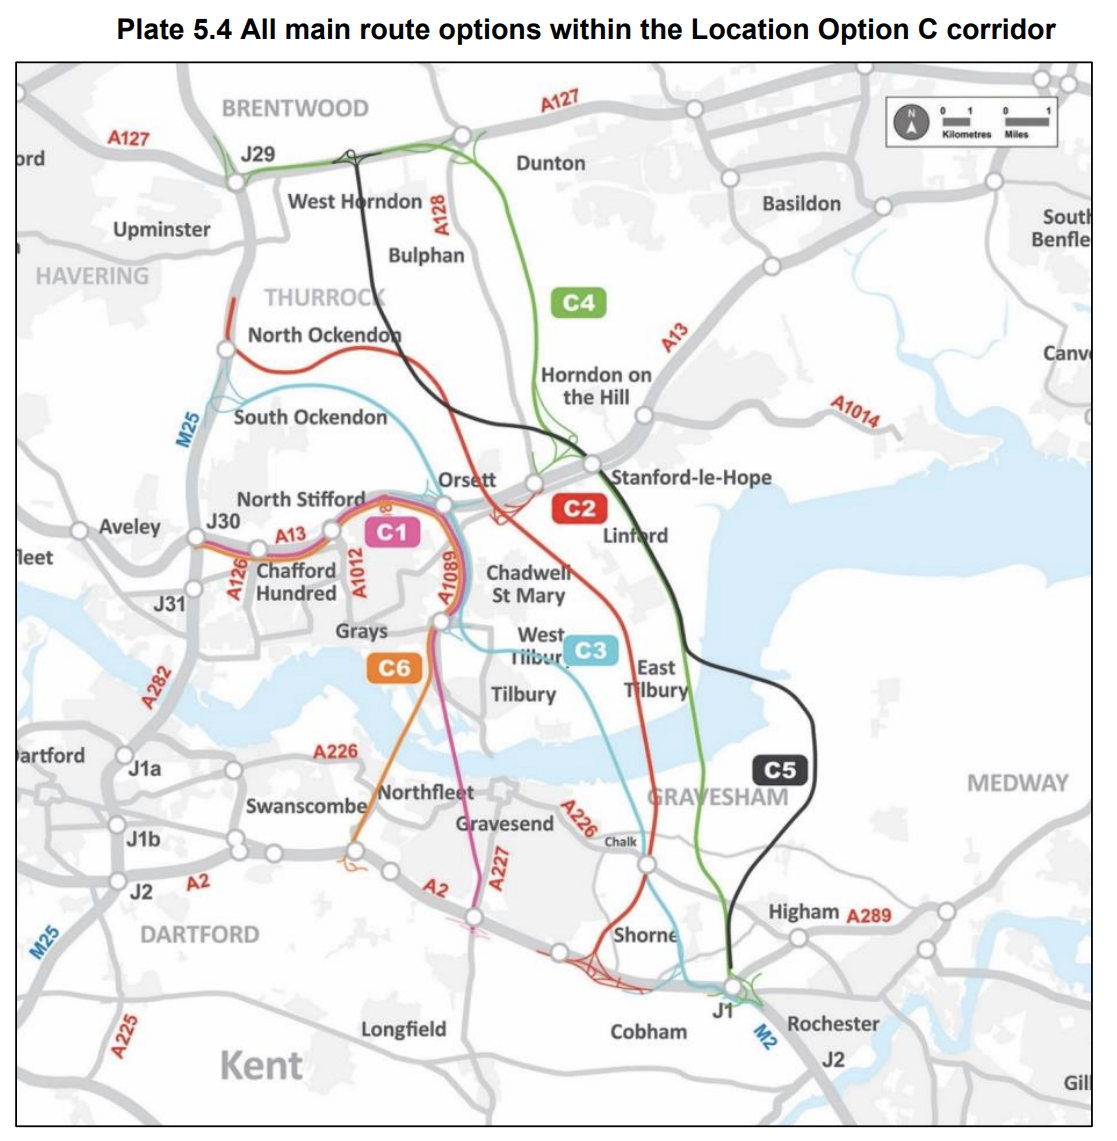
A further four potential options were identified within the C variant Location Option. The C variant options do not provide an alternative for the proposed route, as they constitute an extension of the proposals to connect the M2 to the M20. The assessment of the C variant options considers whether the inclusion of one of the C variant options could provide additional benefits. All route options assessed within the C variant Location Option corridor are presented within Plate 5.5. (Source: National Highways)
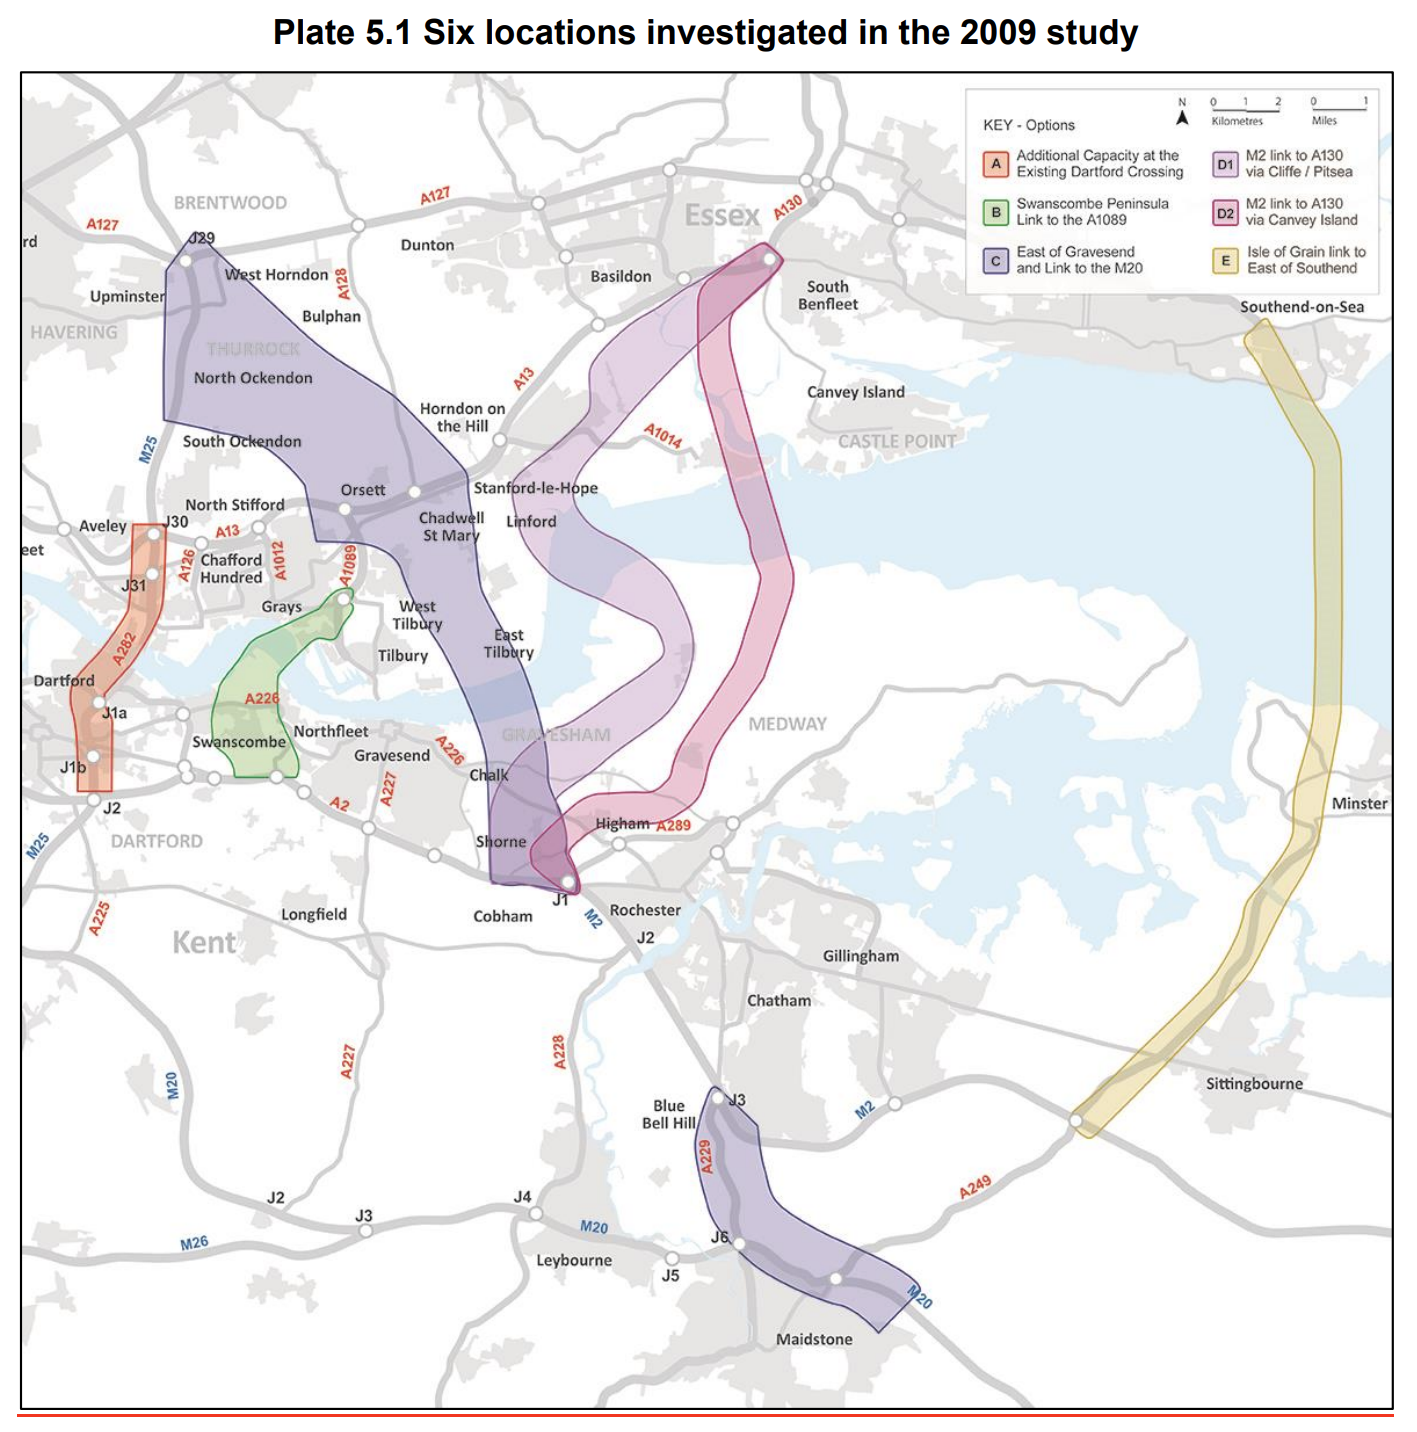
Six locations investigated in the 2009 study. (Source: National Highways)
3F.1. Option C — Eastern Southern Link (ESL): brief reconsideration
What happened in 2016. The ESL variant drew strong local opposition, particularly around Shorne, because public-facing sketches implied a surface corridor through sensitive landscapes and close to homes.
Why it merits a fresh look (if Location C is pursued at all). With the detail now visible for WSL, we can see how constrained the A2/LTC node is. By contrast, at M2 J1 there is more physical space between the M2/A2 and HS1 (save for the Colewood service reservoirs) to accommodate tunnel portals and free-flow link roads. In principle, an ESL re‑design could:
- operate as a free‑flow extension of the M2, separating long‑distance traffic from local A2 movements;
- use short bored/covered tunnels beneath the most sensitive areas (e.g., under Shorne), then emerge in cutting, cross the A226 between Higham and The Copperfield restaurant, and continue toward the North Kent railway line, where the main cross‑river tunnels would begin;
- better align with Kent County Council’s objective to bifurcate Channel‑ports traffic (M2 vs M20 corridors), with a clearer vector for M2 → A13/A130/A12 desire‑lines.
Caveats. This is not an advocacy for “move the road to Shorne.” Any ESL revisit would still face HRA/Ramsar tests, property and landscape constraints, archaeology, and consenting risk; tunnelling adds cost/complexity. But on a merits‑only, design‑led basis, an ESL with tunnels could be preferable to WSL in network performance and local road protection, though still secondary to Option A14 in the author’s view.
3G. Growth risk & capacity headroom
We keep wider economic growth out of the headline economics (so the BCR/NPV stay scheme‑only), but if that growth actually happens it means more trips on the network. Without active management (pricing, lane controls, freight timing), extra demand tends to fill any spare capacity quickly.
What should be published now:
- High‑growth sensitivity tests for opening and design years: e.g., +10–20% cross‑river demand, higher HGV shares, and Thames Freeport/ports‑related growth scenarios.
- Headroom at pinch points: show volume‑to‑capacity (v/c) and queue build‑up thresholds at the A2/M2 tie‑in, A122 northbound portal lanes, and A13/A1089/Orsett Cock.
- A defined contingency toolkit and triggers: ramp metering, dynamic lane/merge controls, temporary or variable charging, freight timing windows/holding areas, and targeted incident management.
- Air‑quality & carbon headroom: make clear what extra demand would mean for AQMAs and scheme carbon budgets.
Bottom line: Growth that boosts “benefits” also increases traffic. Unless there is spare capacity and pre‑agreed controls, communities will feel the congestion and pollution long before the economic claims are realised.
4. Environmental footprint & emissions
4.1 Land‑take / severance
- Option C:
- Order Limits ~23.9 km² (revised to ~23.37 km² in 2023).
- Permanent land ~14.5 km² (post‑refinement).
- Extensive new surface links, junctions, cuttings/embankments, habitat loss/fragmentation, and landscape effects across Essex/Kent.
- Option A14:
- Sub‑surface bored tunnel; surface works mainly at M25 tie‑ins → substantially lower permanent land take and reduced severance vs Option C.
Sources & notes
- Minor Refinement Consultation Booklet (May 2023): Order Limits reduced 23.94 → 23.37 km²; permanent land 14.87 → 14.49 km² (p.7).
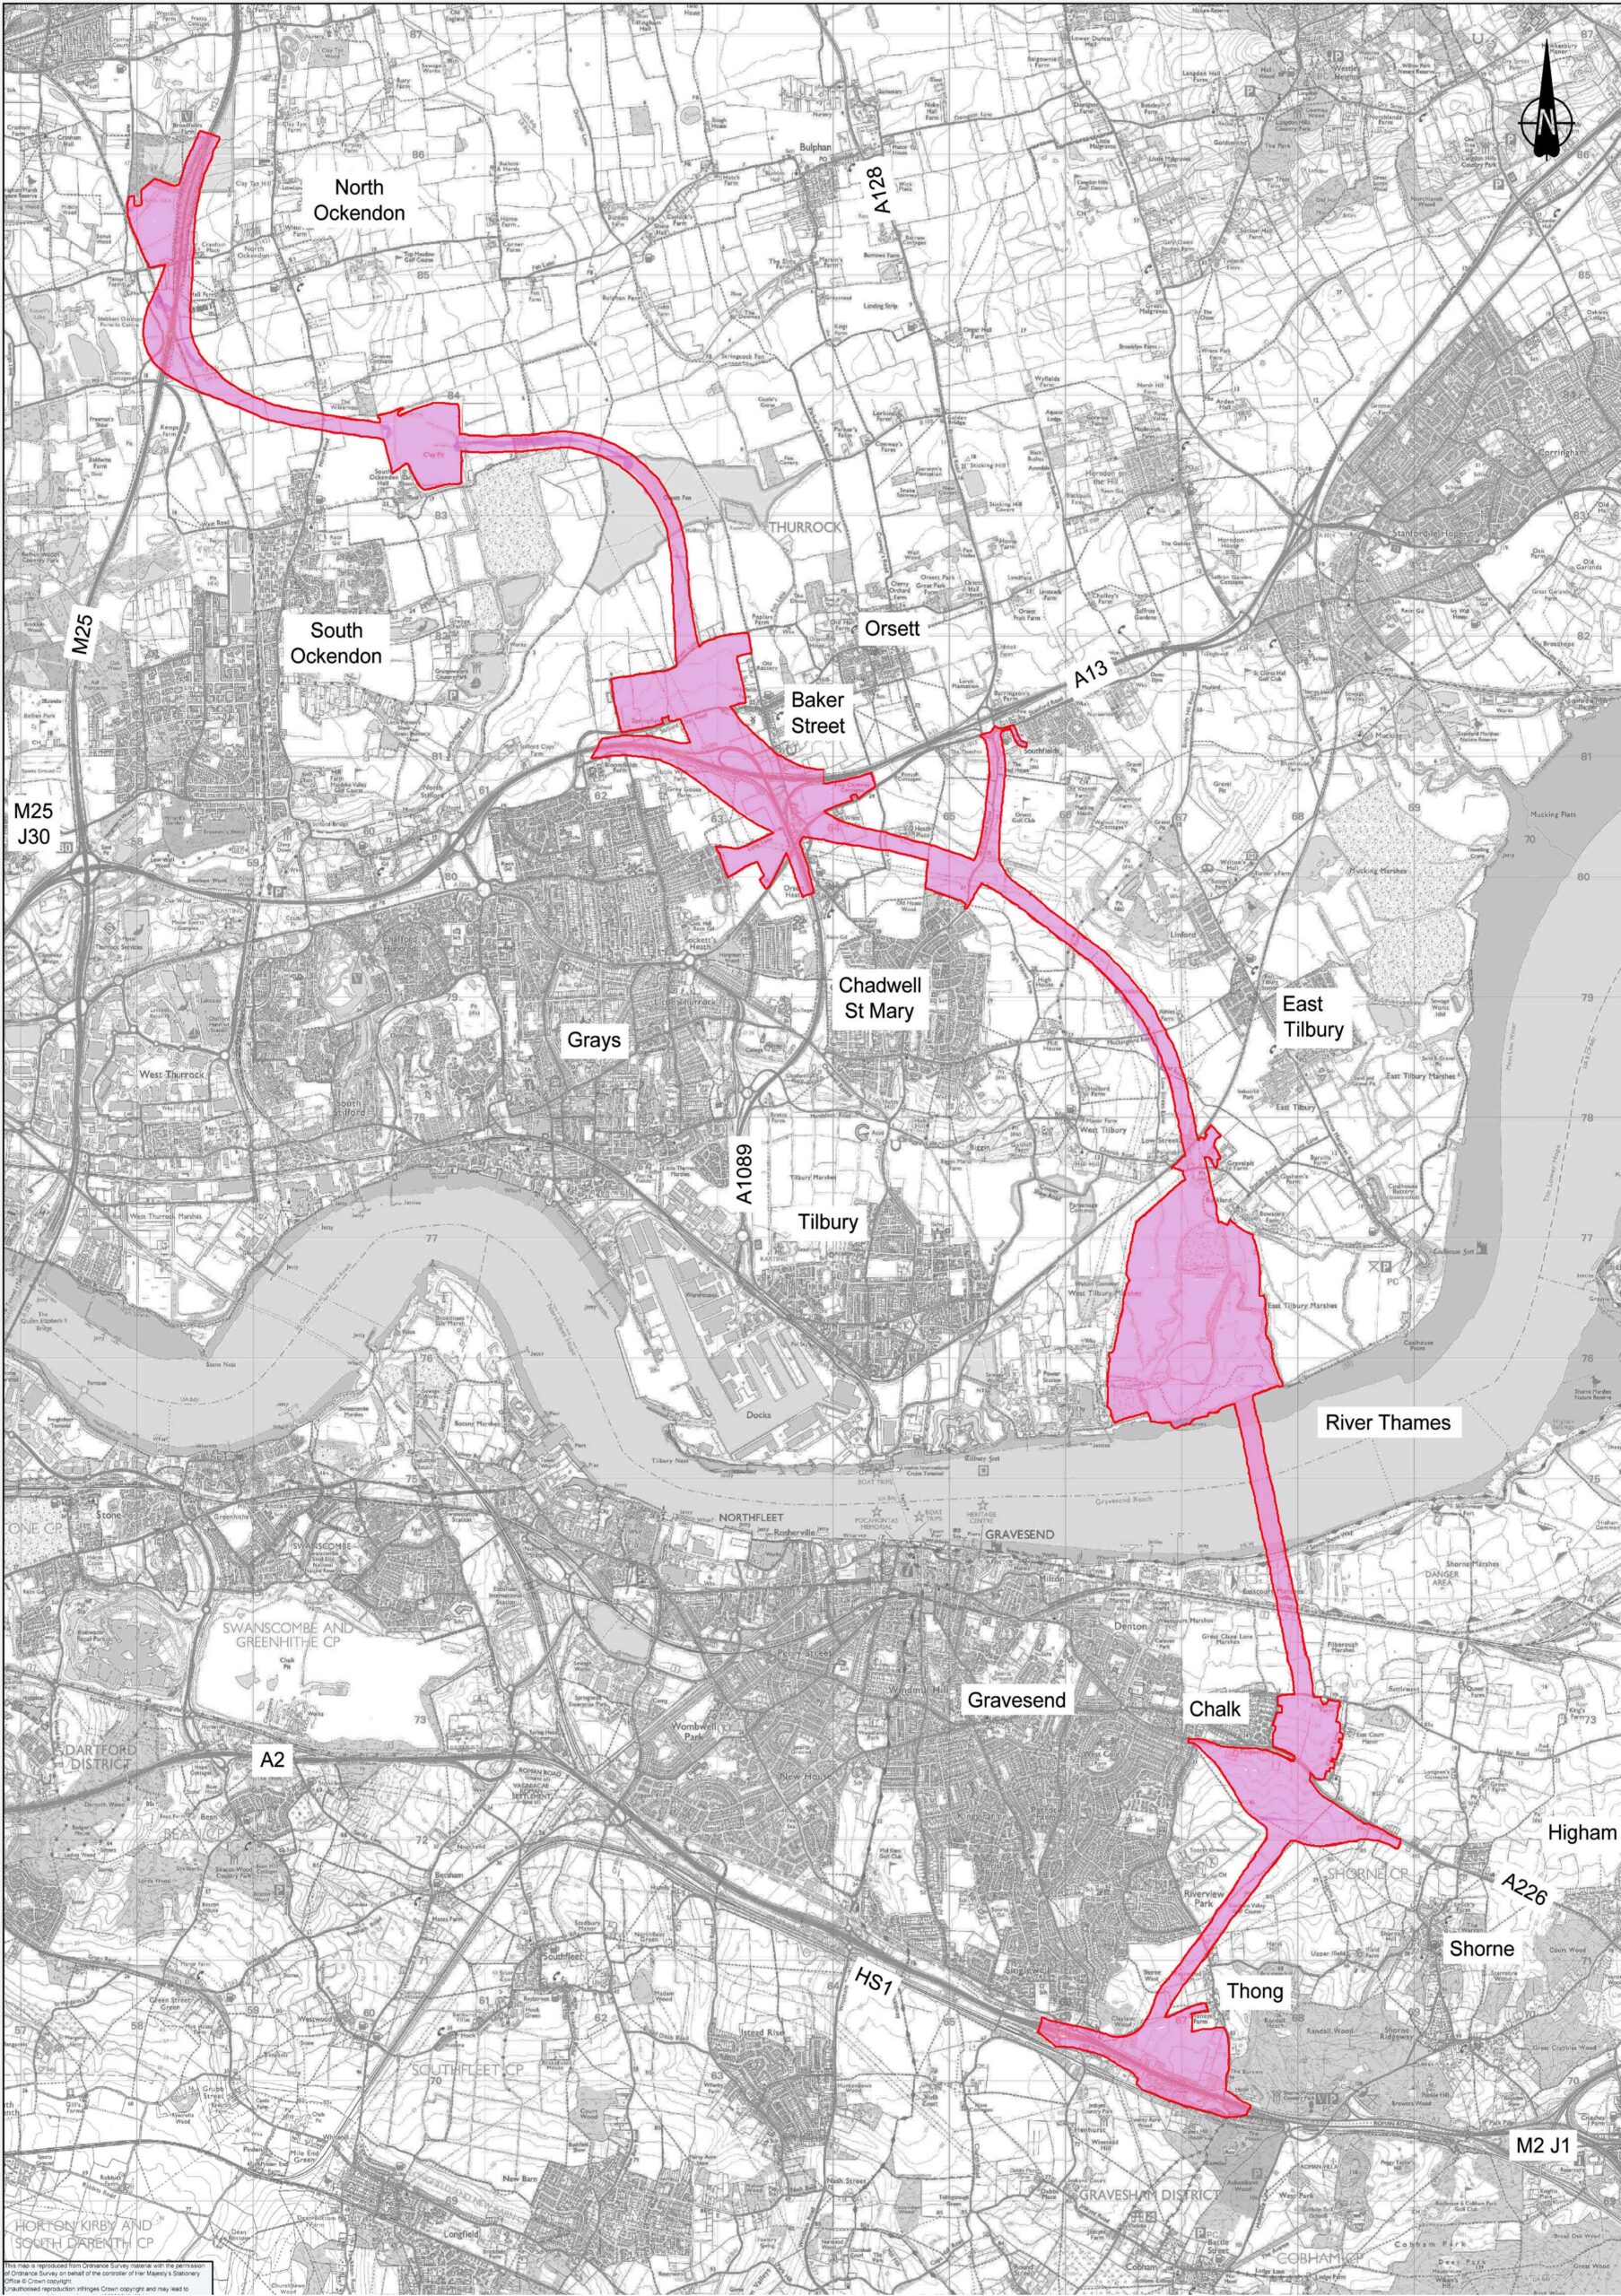
Red Line Boundary Map (Land Take)
4.2 Air quality & tunnel ventilation
- Tunnels collect most exhaust at the portals. Filters can be fitted, but this is not standard practice in UK road tunnels. It uses energy, needs maintenance, and would have to be specified and funded.
- Option C (surface links) spreads exhaust along a long new corridor, creating many places where people could be exposed.
4.3 Side‑by‑side environmental comparison (A14 vs C)
| Topic | Option C (A122 LTC) | Option A14 (Location A long tunnel) | Takeaway |
|---|---|---|---|
| Land take / Order Limits | ∼23.9→23.37 km² Order Limits; ∼14.5 km² permanent land | Surface footprint mainly at M25 tie-ins; sub-surface alignment | A14 clearly lower surface land take |
| Severance / fragmentation | New multi-mile surface corridor; habitat and community severance | Minimal new surface corridor; reduced fragmentation | A14 advantage |
| Air quality (operation) | Open-air dispersion along corridor; multiple receptors | Emissions centralised at portals/shafts; filtration technically feasible if specified | Potential A14 advantage (subject to design/commitment) |
| Landscape / AONB | Wider corridor effects in Essex/Kent; visual/landscape change | Localised portal/junction impacts; less corridor-wide change | A14 advantage |
| Construction impacts | Extensive earthworks, haul routes, junction builds | Tunnelling energy + portal works; fewer new surface links | Mixed; depends on methods |
| Noise | New high-speed links through new areas | Concentrated at portals/M25 | Likely A14 advantage overall |
| Communities affected | Long corridor crosses multiple settlements | Impacts focused near M25 interfaces | A14 advantage |
4.4 Other potential advantages of A14 (beyond land take)
- Less visual impact: most of the route is out of sight; views and skyline changes are limited to portal areas and M25 tie‑ins.
- Wind resilience: unlike bridges, a bored tunnel is not vulnerable to high‑wind closures.
- Quieter alignment: fewer new surface links means fewer homes exposed to new road noise.
- Safety and operations: a reserved, free‑flow M25 mainline (D3M+hard shoulder) reduces weaving and conflict with local traffic.
- Air‑quality control potential: emissions can be collected and treated at fixed points if policy requires it.
- Lower rat‑running risk: no new corridor through communities reduces the incentive for cut‑throughs on local roads during busy periods.
5. Claims vs evidence
How to read this section. For each item we show: what National Highways said then (in their own documents), what is now recorded in official documents, and why that matters to people and places here. If we can’t back an item with a clear citation, we leave it out until it can be evidenced. Honesty first.
1) “Open in 2025 (or 2027 with private funding)” → Consented in March 2025; opening pushed back
National Highways said then: The 2016 consultation booklet anticipated opening by 2025 (or 2027 with private finance).
Now recorded in official documents: Consent was granted in March 2025 and delivery moved into the 2030s.
Why it matters: Delays reduce discounted benefits and can increase costs; the Initial BCR will tend to fall when the opening year slips. Meanwhile, substantial spend has already occurred before construction—reported as over £800m by January 2025 and around £1.2bn by mid-2025. Within that pre-construction spend, press and parliamentary sources indicate c. £300m attributable to the planning/consenting application (document preparation, consultations and examination). Independent reporting puts the total scheme at at least £9.2bn, potentially ~£10bn depending on financing.
Sources & notes — §5.1 (timelines, costs & spend)
- Financial Times (7 Mar 2025): “Lower Thames Crossing has cost £1.2bn even before construction starts” (paywalled) — reports ~£1.2bn pre-construction spend.
- Financial Times (22 Apr 2025): “One-third of Lower Thames Crossing spending so far used on planning documents” (paywalled) — highlights the scale/cost of planning/consenting.
- The Guardian (25 Mar 2025): “Lower Thames Crossing plan for Essex and Kent approved by government” — notes nearly £1bn spent on redesigns/consultations.
- The Guardian (16 Jun 2025): “UK government pledges further £590m for delayed Lower Thames Crossing” — states total cost at least £9.2bn and £1.2bn already spent.
2) “High value for money (BCR > 2)” → Latest Initial BCR ≈ 0.48; Adjusted ≈ 1.22
National Highways said then: The 2016 Scheme Assessment Report (SAR) presented BCRs above 2 for Location C in its shortlist appraisal (initial 2.3–1.7, adjusted 3.4–2.5, by option).
Now recorded in official documents: The DCO appraisal reports Initial BCR ≈ 0.48 and Adjusted ≈ 1.22.
Why it matters: The economic case weakened markedly between early option sifting and the DCO; relying on WEBs to reach “Low/Medium” VfM masks poor scheme-only performance.
Sources & notes — §5.2
- Pre-Consultation SAR – Volume 7: Appraisal Conclusions & Recommendations (Jan 2016)
- Post-Consultation SAR – Volume 7: Appraisal Conclusions & Recommendations (Mar 2017)
- Economic Appraisal Report (ComMA, Mar 2024)
- Combined Modelling & Appraisal — Central Case: Section 1 Overview (Mar 2024)
3) “+70% Thames crossing capacity” → Dartford relief fades by the 2040s
National Highways said then: SAR factsheets highlighted a large capacity uplift (around +70%) and an opening-year ~14% reduction in flows at Dartford.
Now recorded in official documents: DCO modelling shows that by the mid-2040s, Dartford flows are close to 2016 levels, as overall cross-river demand grows.
Why it matters: Classic induced traffic — added capacity attracts more trips, so relief is short-lived unless backed by demand management.
Sources & notes — §5.3
- Scheme Assessment Report — Volume 7 (Post-Consultation, Mar 2017): capacity uplift and opening-year Dartford reduction
- Combined Modelling & Appraisal — Central Case: Section 1 Overview (Mar 2024)
4) “Modern 70 mph motorway-to-motorway” → Classified as an all-purpose trunk road in the DCO
National Highways said then: Early public material described a 70 mph motorway-to-motorway link.
Now recorded in official documents: The DCO documentation classifies the A122 Lower Thames Crossing as an all-purpose trunk road (not a Special Road/motorway).
Why it matters: While 70 mph can still be set, designation and standards differ; this affects enforcement, lane management and access rules.
Sources & notes — §5.4
- TR010032/APP/1.3 — Introduction to the Application (Planning Inspectorate): “an all-purpose trunk road”
- National Highways: About the Lower Thames Crossing
5) “C-Variant (A229) not essential” → Treated separately later; dependency risks remain
National Highways said then: The 2016 SAR defined the Location C Variant as additional widening of the A229 between the M2 and M20 — described alongside but not integral to the core crossing.
Now recorded in official documents: Multiple DCO documents and Statements of Common Ground state that the A229 Blue Bell Hill is not part of the Project; KCC is pursuing a separate scheme with uncertain funding/timing.
Why it matters: If not delivered at or before opening, the already-stressed M2/A229 corridor risks worse queues and air-quality impacts (Medway/Maidstone), while the connectivity case for Option C is weakened.
Sources & notes — §5.5
- SAR Volume 2 — Introduction & Existing Conditions: definition of “Location C Variant” (A229 widening)
- Statement of Common Ground — National Highways & Tonbridge & Malling BC (Doc 74): “A228 and the A229 are not part of the proposed Project”
- Kent County Council: A229 Blue Bell Hill Improvement Scheme
- Kent County Council: A229 Blue Bell Hill Update (Jan 2025)
6) “Environmental improvements” → Very large Order Limits and permanent land take
National Highways said then: The scheme was framed as bringing modern environmental benefits.
Now recorded in official documents: NH’s own updates and consultee correspondence record Order Limits ≈ 23.37 km² and permanent land ≈ 1,450 ha (14.5 km²).
Why it matters: This is a large surface footprint with severance and landscape effects across multiple communities, compared with a largely sub-surface A14 concept.
Sources & notes — §5.6
5A. Sensitivities & risks
- Demand and growth: updates to national travel demand forecasts (NTEM); induced traffic; freight growth and Thames Freeport/estuary regeneration scenarios; no explicit published operational headroom or trigger thresholds for management if demand runs “hot.”
- Costs: tunnelling risk vs extensive surface works; optimism bias; carbon pricing.
- Policy interactions: A229 Blue Bell Hill treated separately; removal of C Variant undermines C’s connectivity case to the M2 corridor.
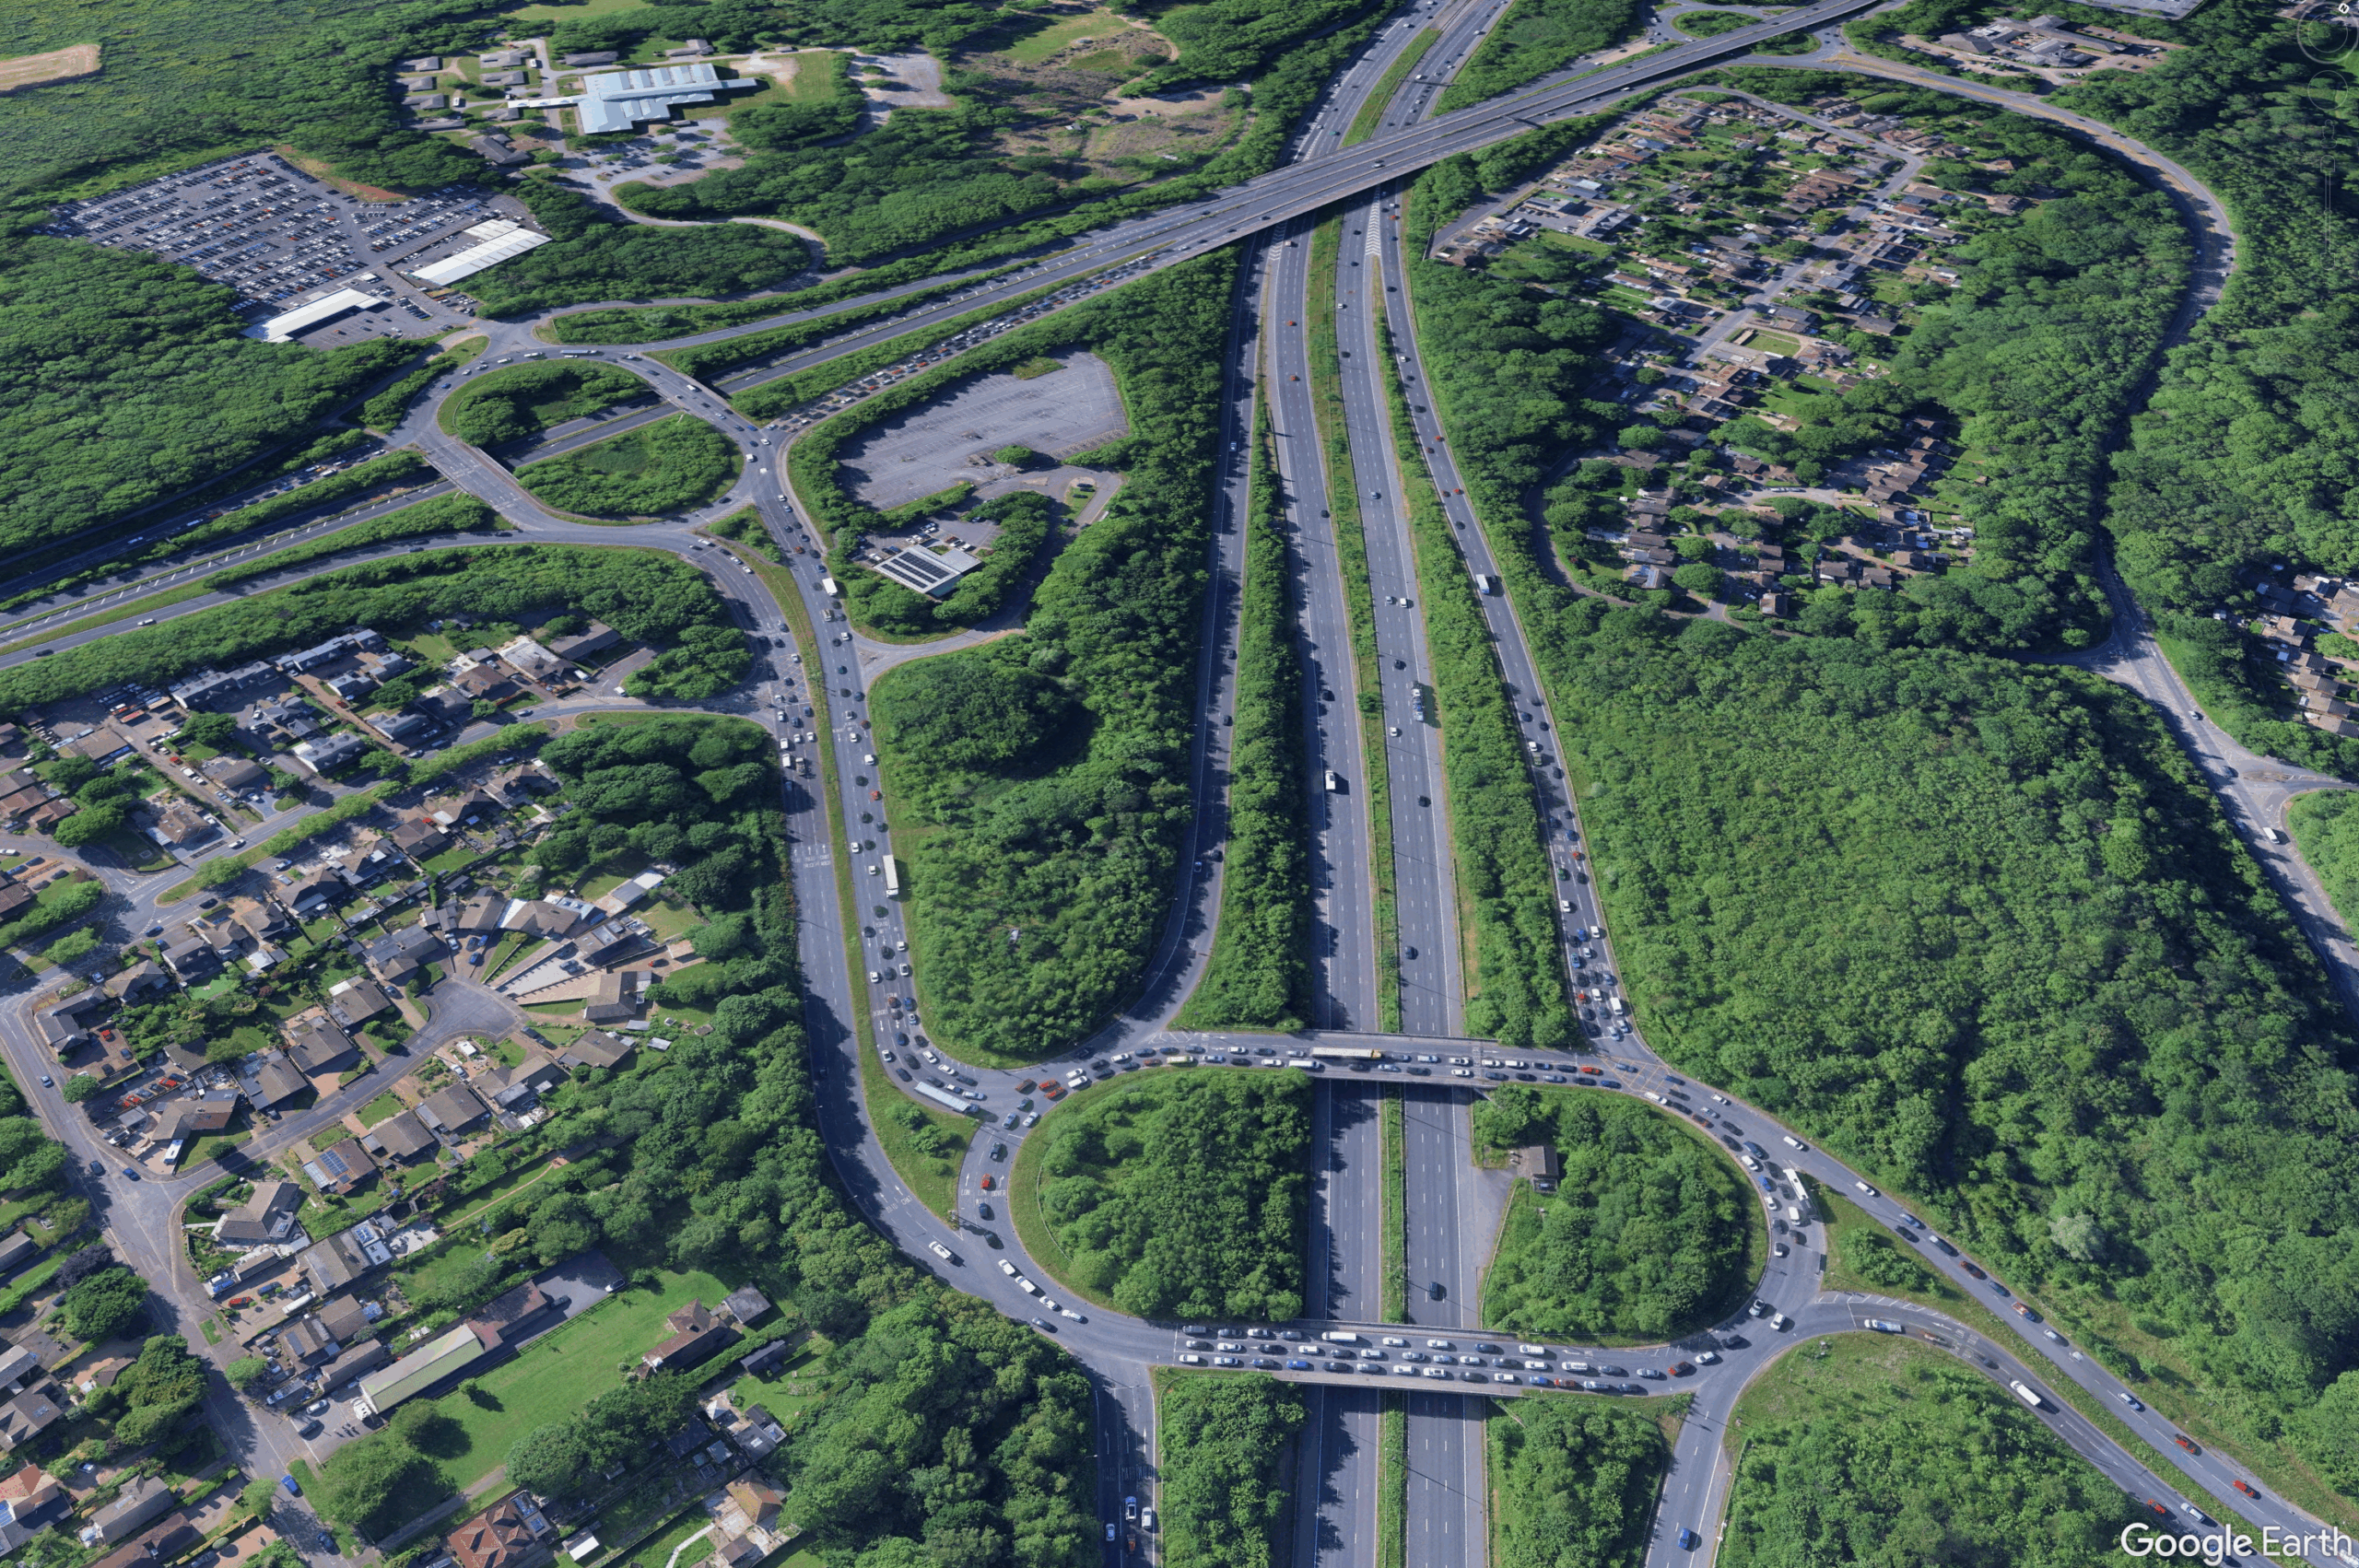
M2 J3 Blue Bell Hill (Google Earth)
Note — C-Variant dependency risk (A229 Blue Bell Hill): why this matters now • Likelihood: Delivery depends on external funding approvals and a local match; KCC’s finances are constrained, so timing is uncertain. • Operational consequence if not in place at LTC opening: The M2/A229 (Blue Bell Hill) junction is already highly stressed; extra LTC-related movements on the M2/M20/A229/A2045 corridors would intensify queues, spill back to M2 J3, and push traffic into Medway and Maidstone local roads, with air-quality and safety impacts. • Network effect: Without C-Variant, Option C’s connectivity benefits on the M2 corridor are diminished, while negative impacts increase. • What should happen: Treat C-Variant as an assumed-not-delivered sensitivity in modelling, publish the results, and identify interim mitigations (e.g., ramp metering at J3, temporary lane/merge management, freight timing/holding, and local network protection).
6. Alternative considered — Duplicate QEII bridge (Route 1)
6.1 What it is (in brief)
An online capacity increase at Dartford, adding a second road bridge parallel to or near the existing QEII bridge within the A282/M25 corridor. Tie‑ins at existing junctions (J1a/J1b/J2 and J30/J31) with associated approach widening and lane‑balance works. Operational concept: the new bridge would provide northbound river‑crossing capacity, with the existing QEII bridge continuing to serve southbound traffic.
6.2 Why some favour it
- Targeted at the actual pinch‑point. Directly addresses the Dartford river crossing constraint rather than creating a long new corridor elsewhere.
- Potentially quicker to deliver. Works largely within an existing strategic corridor with established utilities and access (still complex, but fewer miles of new alignment than Option C).
- Lower new land‑take. Additional land mostly for approach widening and structures, not multi‑mile greenfield links.
- Operational coherence. Keeps long‑distance M25 flows on the M25/A282 corridor, aligning with the author’s free‑flow motorway‑standard principle.
- Resilience at the crossing. Extra river‑span capacity provides more options during incidents/maintenance at the QEII bridge or tunnels.
6.3 What it could achieve (near‑term)
- A second bridge would add northbound river‑crossing capacity and could reduce queues at first. However, unless it is paired with effective charging and demand management, that benefit is likely to fade over time as more drivers switch to the route.
- It should be possible to keep long‑distance M25 traffic moving in separate, free‑flow lanes, while local Dartford and Thurrock traffic continues to use the existing junctions. To make this work in practice would require clear lane management (signs, markings and enforcement) and, if appropriate, a consistent charging policy.
6.4 Key challenges / why it has been discounted historically
- Air quality & legal compliance risk (Dartford/Thurrock AQMAs). Adding capacity in the worst-affected air-quality corridor concentrates more traffic and emissions where compliance is already tight. This is a major legal/planning risk even if total corridor land-take is modest.
- Weaving and junction geometry. The A282 between J2 and J30/31 already has intense weaving/merges. A duplicate bridge implies substantial approach and junction reconstruction (viaduct widening, lane-balance fixes, auxiliary lanes) — adding cost, complexity and disruption during construction.
- Northbound vs southbound asymmetry. The tunnels constrain dangerous goods and heights; a new northbound bridge could address these constraints if designed and operated accordingly, but would still require substantial approach works and clear operational protocols (and does not remove wind/incident vulnerabilities).
- Wind/incident vulnerability. Bridge assets face wind closures and exposed-structure risks; resilience gains depend on management protocols not just raw capacity.
- Induced traffic. As with any added capacity at the pinch-point, initial relief can erode over time as demand expands (the “fundamental law” problem), especially without pricing/demand management.
- Value for money over time. Early work in 2016 showed a higher initial BCR. By 2017, once extra costs and constraints were added, it compared less well with Location C. Today, a fair, like-for-like merits-only update would be needed to judge it properly.
6.5 Merits‑only verdict (our view)
A duplicate QEII bridge should not be dismissed out of hand if the policy objective is specifically “fix Dartford”. Most stakeholders expect it would provide short‑term relief but not a durable long‑term solution. It is targeted and may be faster to realise than a new greenfield corridor. However, it carries serious legal/air‑quality risks, major approach‑junction engineering, and the same induced‑traffic vulnerability that undermines longevity of relief.
If ministers commission an options refresh, a fair, merits‑only test of a duplicate bridge should:
- Be paired with a clear charging/management regime (to protect local communities and sustain through‑flow benefits).
- Include approach‑junction upgrades and weaving fixes in the core scope (not as later add‑ons).
- Report scheme‑only BCR/NPV and opening‑year vs mid‑2040s flows transparently, alongside air‑quality compliance modelling.
7. Conclusion & side‑by‑side comparison
- On transport economics and congestion, A14 ≈ C (both poor).
- On environment, A14 appears preferable on land‑take and potential emissions control, assuming modern tunnel standards.
- Therefore, choosing C over A14 appears driven less by intrinsic scheme merit and more by strategic/policy preferences (connectivity to A2/A13; Thames Estuary growth narrative).
7A. Side‑by‑side comparison (summary)
| Criterion | Option C (A122 LTC, WSL) | Option A14 (Location A long tunnel) | Duplicate QEII bridge |
|---|---|---|---|
| Initial BCR (scheme-only) | ∼0.48 (Poor) | ∼0.47 (Poor) | Earlier work higher; needs updated merits-only run |
| NPV (scheme-only) | Negative | Negative | Needs refresh |
| Surface land take | High (∼23.9→23.37 km² Order Limits; ∼14.5 km² permanent) | Low (mainly M25 tie-ins) | Low–moderate (approach widening/structures) |
| Air quality (operation) | Emissions along new corridor | Emissions concentrated at portals; filtration possible if specified | Localised at Dartford; AQMA risk |
| Incident resilience | Creates diversion to LTC; A2/local roads pressure unless managed | Keeps M25 free-flow if designed as continuous D3M; still relies on Dartford operations | Adds northbound river capacity but wind/incident vulnerability remains |
| Weaving/junction risk | New junctions and merges along corridor | Focused at M25 tie-ins | High between J2 and J30/31 without major re-engineering |
| Visual/landscape | Wide corridor impacts | Localised portal/junction impacts | Concentrated at Dartford |
| Delivery complexity | Long new alignment; many interfaces | Long bored tunnel; fewer surface interfaces | Heavy works in constrained A282 corridor |
Note on junction complexity & expandability (A14 vs C). The A2/LTC node relies on a dense web of connectors constrained by HS1 to the south and protected/valued land to the north; this complexity and lack of physical space mean no practical room for future widening. An A14 solution concentrates works within the M25 corridor with simpler tie‑ins, keeping the strategic mainline free‑flow by design.
8. Policy separation: Dartford relief vs Thames Estuary growth
Evidence that “growth in the Thames Estuary/Thames Gateway” was an explicit policy aim
• DfT 2013 consultation (context for selecting a location): the existing crossing is “located in the Thames Gateway area, which successive Governments have recognised as a national priority for redevelopment and growth.”
Source: DfT, Options for a new Lower Thames Crossing (2013), p.7. GOV.UK• Government response (2019) to the Thames Estuary 2050 Growth Commission: commits to “multi-billion-pound investments in the Lower Thames Crossing” and to “realise the wider benefits of the Lower Thames Crossing” via a cross-government group.
Source: MHCLG, Government response to the Thames Estuary 2050 Growth Commission (2019), pp.6–7. GOV.UK• Thames Estuary 2050 Growth Commission vision (2018): by 2050, the Estuary “will generate an additional £190 billion GVA and 1.3 million new jobs.”
Sources: Thames Estuary 2050 Growth Commission – Vision (2018) PDF and GOV.UK landing page. GOV.UKGOV.UK• National Highways project materials: the scheme is presented as helping to “unlock growth.”
Sources: Benefits of the Lower Thames Crossing and Project overview. National Highways
Looking back: One project was asked to do two jobs: (i) fix Dartford and (ii) boost Thames Estuary growth. These are different problems and should be judged separately. (i) fix Dartford and (ii) boost Thames Estuary growth.
- Fixing Dartford calls for measures that directly tackle the crossing and its approaches (for example, a duplicate QEII bridge/tunnel, junction and weaving fixes, incident management, and pricing). Judge these on transport outcomes in the Dartford corridor.
- Supporting growth should focus on investments inside the growth areas (e.g., the Isle of Sheppey and Medway), with better local road/rail access that directly helps deprived communities.
For any re‑evaluation: keep objectives separate and avoid “two birds, one stone” unless both aims are clearly met on scheme‑only evidence.
8A. A practical cap on road width and default to demand management
Author’s principle. Britain cannot keep adding lanes indefinitely. We should set a national upper bound for strategic mainline width—e.g., up to four lanes each way (D4M), with at most local auxiliary lanes near very busy junctions—and then default to demand control beyond that. The tools include pricing/charging, time‑of‑day management, managed lanes, freight retiming/holding, access management, and support for rail/public transport and freight alternatives. The design goal is a free‑flow strategic spine for long‑distance movements (e.g., an A14‑type continuous mainline), not ever‑wider carriageways that draw in local demand and recreate congestion.
Community perspective
Residents in Dartford, Gravesham, Thurrock and Medway have repeatedly raised the same issues: A2/M2 congestion during incidents, rat-running on local roads, air quality around schools and the sheer land-take of new surface corridors. The ask is simple: fix Dartford by design—keep long-distance traffic free-flow—and don’t push the problem onto local communities.
9. External evidence & corroboration (selected)
Independent material we can cite in‑text (e.g., “as reported by…”, “as confirmed by…”). Full links are provided in the sources list and footnotes.
-
Transport Action Network (TAN), High capacity alternatives to a road‑based Lower Thames Crossing (Feb 2025). Compares non‑road options and questions road‑only focus; argues higher capacity can be achieved without a new road corridor.
-
TAN, Written Representation to the LTC Examination (2022–23). States the scheme is low value for money (Adjusted BCR 1.22) with substantial adverse impacts; collates NH figures on costs, carbon and traffic.
-
TAN, How the Lower Thames Crossing will take your funding (Apr 2025). Argues the LTC diverts limited transport budgets from maintenance and local schemes; summarises rising scheme costs.
-
CPRE Kent, Written Representation (2023) and statement on DCO approval (Mar 2025). Concludes that adverse environmental and financial impacts outweigh benefits; criticises outdated approach and net‑zero inconsistency.
-
National Audit Office (NAO), Progress with the Second Road Investment Strategy (RIS2) (Nov 2022). Highlights schedule, affordability and value‑for‑money risks across National Highways’ portfolio—useful context for LTC cost and VfM pressure.
-
DfT, Value for Money Framework (updated May 2025). Sets VfM categories and treatment of WEBs/reliability; supports our merits‑only focus on Level‑1 impacts.
-
SACTRA (1994), Trunk Roads and the Generation of Traffic. Finds that new road capacity induces additional traffic—foundational evidence explaining why congestion relief may be short‑lived.
-
Duranton & Turner (2011), The Fundamental Law of Road Congestion. Empirical evidence that vehicle‑kilometres rise with lane‑kilometres, reinforcing induced‑traffic mechanisms.
-
Transport for Quality of Life (2017 & later). Reviews post‑opening evaluations and finds limited evidence that road schemes deliver promised local economic growth.
10. Methods, data notes & FAQ
- AI assistance & human review: An AI tool was used to retrieve, cross‑reference and check consistency across public documents (2016 consultation, DCO library, local‑authority evidence). The tool did not create new traffic modelling or economics; all numbers are taken from cited sources. The author reviewed, corrected and approved the wording and conclusions.
- Price base & values: Unless stated, economic figures are in 2010 prices and values (DfT TAG standard). BCR = benefits ÷ costs; NPV = benefits − costs.
- Scope: We use scheme‑only (Level‑1) impacts for the headline comparison. Adjusted BCRs that add WEBs/reliability are noted but not used as the headline.
- Sources: 2016 consultation pack (booklet, SAR Vols 4–7, factsheets) and later ComMA/AST; page references are provided in the footnotes.
- Charging assumption: Early modelling assumed Dartford‑equivalent user charges, constant in real terms. Different charging changes outcomes.
- Uncertainty: Traffic forecasts vary with NTEM updates, economic growth and policy. Where figures differ between 2016 and DCO, we show the direction of change.
- Forecast growth vs WEBs: Excluding WEBs from the headline BCR keeps the appraisal honest; it doesn’t mean growth risk is ignored. If growth runs ahead of forecast, traffic and queues rise, so capacity headroom and management triggers must be set out.
FAQ
- Does a tunnel mean the air is filtered? Not by default. UK road tunnels don’t normally include filtration. It can be added, but needs budget and energy and must be designed in.
- Why don’t models plan for big incidents? Strategic models usually represent an average day. We recommend publishing incident scenarios (northbound tunnel closures, high‑wind QEII closures, multi‑hour events) so people can see A2/M2 and local‑road impacts.
- Will the LTC remove or reduce Dartford charges? Early assumptions were same as Dartford, constant in real terms. Actual policy is a ministerial decision and will change driver route choice and congestion.
11. Case for re‑evaluation
Why re‑evaluate now (summary points):
-
Merits‑only parity: Option C and A14 are economically indistinguishable on scheme‑only terms (Initial BCR ~0.48 vs ~0.47).
-
Environmental differentiation: A14 offers substantially lower surface land take and potential for centralised emissions control.
-
Benefit durability: Forecasts show short‑lived Dartford relief, with flows returning towards 2016 levels by mid‑2040s.
-
Budget pressure: record public borrowing, persistent inflation and tighter capital budgets heighten the need to prioritise schemes with robust scheme-only VfM.
-
Consultation transparency: Material inputs and sensitivities were not made readily accessible to the public (e.g., J2 turning matrices, A13 vs M25 splits, incident/maintenance scenarios). Decisions should be revisited once this evidence is published and tested.
-
A14 option handling: Given the scheme‑only parity and the environmental advantages listed, Option A14 should not have been discounted so early. It merited detailed design and side‑by‑side testing against Option C (including incident scenarios on the A2/M2).
-
Objective separation: Dartford relief and Estuary growth are distinct problems; conflating them risks sub‑optimal outcomes.
-
White‑elephant risk: Proceeding without transparent testing of these points risks locking in a large, high‑impact scheme that under‑delivers on its stated objectives while worsening congestion and air quality on the A2/M2 corridor.
Recommendation. In light of the above, Government should pause the project now (including enabling works), and commission a short, independent, merits‑only options refresh that takes Option C (WSL), Option C (tunnel‑led ESL), Option A14, and a duplicate QEII bridge to a comparable level of detailed design for a like‑for‑like comparison. Only then should ministers decide which option, if any, proceeds.
11A Decision gates & pause criteria
Decision gates (to proceed)
- Gate A — Evidence: Turning matrices, lane-by-lane storyboard and incident scenarios published.
- Gate B — Performance: No red v/c cells at the A2/M2/LTC node in opening-year and incident scenarios; mitigations identified where amber.
- Gate C — Value: Scheme-only Initial BCR ≥ 1.0 or a documented non-monetised case with signed mitigations and AQ compliance.
If A/B/C are not met, pause, complete the options refresh, and return to ministers with a side-by-side comparison.
Table 11.1 — Cost risk register (snapshot)
Why this matters now. Before committing further public money, ministers should have a clear, quantified view of the major cost drivers and the likely outturn range. The register below summarises the top risks and the mitigations required to keep the project within an affordable envelope.
| ID | Risk | Driver | Prob. | Impact (£m) | P50 effect | P90 effect | Mitigation | Owner | Status |
|---|---|---|---|---|---|---|---|---|---|
| R1 | Geotechnical variance (tunnel) | Unexpected ground; water ingress; conditioning | Med | 150–300 | +£90m | +£240m | Advance GI; TBM contingency; slurry treatment capacity | NH/Contractor | Open |
| R2 | Utilities diversions | Scope growth; protection standards | High | 80–160 | +£70m | +£140m | Early C3/C4s; alliances; re‑route design to avoid | NH/Utilities | Open |
| R3 | A2/M2 node complexity | Constrained geometry; staging/traffic management | High | 120–220 | +£85m | +£180m | Phased works; off‑peak windows; temporary alignments | NH/Contractor | Open |
| R4 | HS1/Network Rail interfaces | Consents; possessions; protection | Med | 40–90 | +£30m | +£70m | Early agreements; shared risk funding; integrated programme | NH/HS1/NR | Open |
| R5 | Air quality compliance actions | Additional mitigation to achieve legal limits | Med | 30–80 | +£25m | +£65m | Targeted barriers, planting, filtration options, pricing | NH | Open |
| R6 | Programme delay / inflation | Procurement timing; market capacity | High | 150–350 | +£120m | +£300m | Early packages; indexation strategy; risk‑sharing | NH/Treasury | Open |
| R7 | A229 dependency | Third‑party funding/timing outside LTC | Med | 40–100 | +£20m | +£80m | Interim mitigations; separate funding decision; staged opening | KCC/NH | Open |
Values indicative for structure only. Replace with project risk model outputs (QRA) when available.